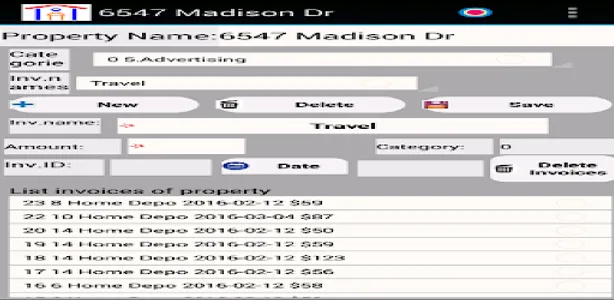
The application is used for processing documents for expenditure relating to leased properties. For property are entered and edit expense documents– invoices. Each document is associated with the date (of creation or data entry of it) and indicators from Form 1040 - Supplemental Income and Loss - Canada. These include the following indicators: from sec. 5 to sec. 20 of the same shape. It can be bring as options and other indicators or replace existing ones according tax needs from other countries or specific user needs.
The application allows aggregation of receipts from date to date and forecast the cost of a separate category or for all categories.
The app stores the data entered for a properties in a database of type Sqlit named propertiesEnterprise.db.
The application offers: "Time series" - displays graphics and data time series, "Autocorrelation" - displays graphics and data of the autocorrelation of the time series, "Simple exp. smoothing "- displays graphics and data of simple exponentially predicting ," Simple moving average"- displays graphics and data of simple movement of average," Linear exp. Smoothing "- displays graphics and data of linear exponential prediction, "Holt's Linear exp. smoothing "- displays graphics and data Holt's linear exponentially prediction and “Additive damped trend” - displays graphics and data of additive damped trend.
The application is intended to generate result data in determining the tax on rented property. The application is used for processing documents for expenditure relating to leased properties. Each document is associated with the date (of creation or data entry of it) and indicators The indicators are legally established for a given country
Show More


