Record body temperature.
You can record the body temperature by specifying the date and time.
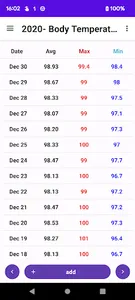
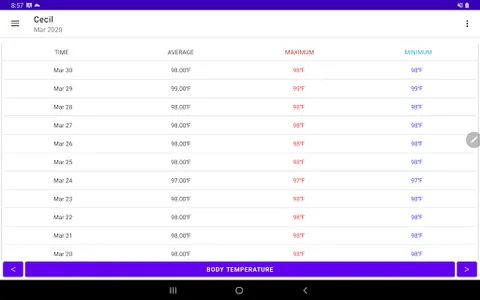
Record the daily body temperature and display it in a graph.
You can check the body temperature for each record with a line graph.
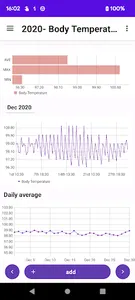
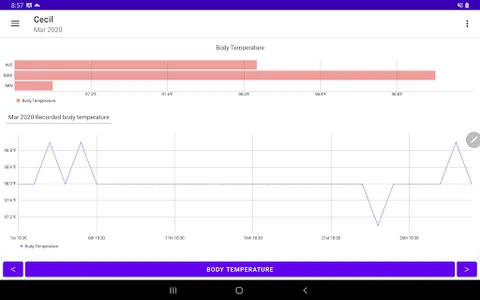
You can check the maximum body temperature / minimum body temperature / average body temperature for each month on the horizontal bar graph.
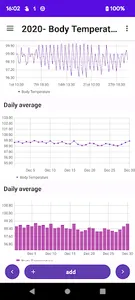
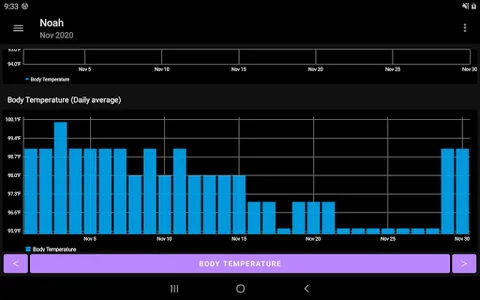
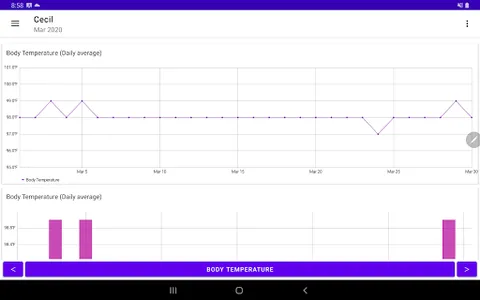
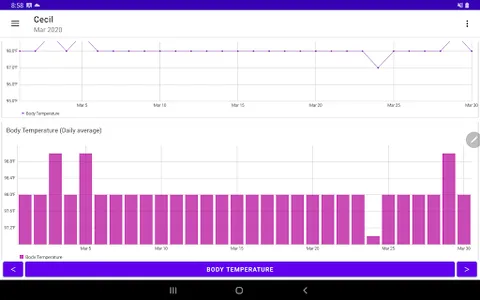
The daily average body temperature is displayed as a line graph and a bar graph.
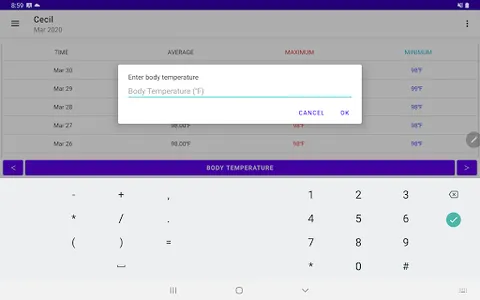
▼ Procedure to record body temperature
1. Tap the body temperature button
2. Select the date when the body temperature was measured and tap Next
3. Select the time when the body temperature was measured and tap Next
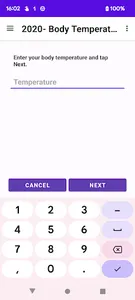
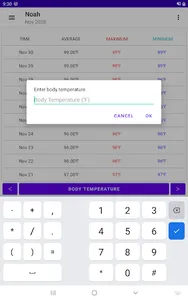
4. Enter the measured body temperature and tap OK
5. Confirm and tap Done
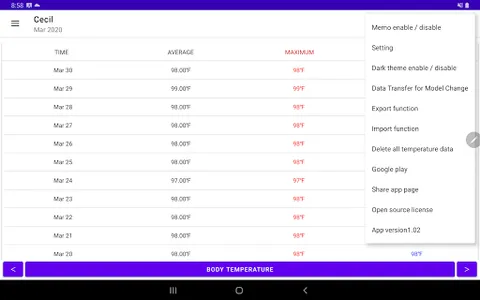
▼ Note
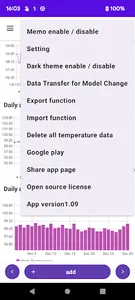
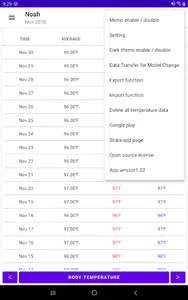
You can take a note by selecting "Memo enable/disable" from the menu on the upper right.
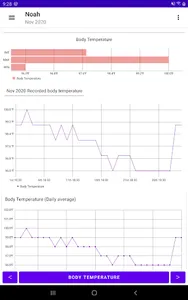
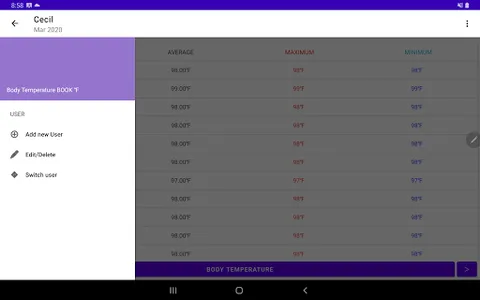
▼ Body temperature bar chart
The average, maximum and minimum of body temperature for each month are displayed in a horizontal bar graph.
If you record your body temperature more than twice a month, a horizontal bar graph of body temperature will be displayed.
▼ Body temperature (for each record)
A line graph of body temperature for each record is displayed.
When you tap the title text at the top of the graph, the calendar will be displayed and you can specify the period. Display a line graph with a record of body temperature for the selected time period.
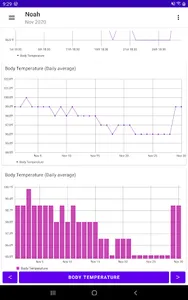
▼ Body temperature (average daily) line graph
A line graph for one month is displayed.
A line graph is displayed when there are records for 3 days or more.
▼ Body temperature column chart
Display a column graph of body temperature for one month.
Displays a column graph when there are records for 3 days or more.
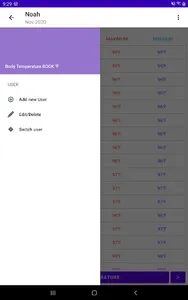
▼ Check daily records
If you recorded multiple times a day, tap the daily column in the table above
Display daily page. Display a line graph at the top of the daily page.
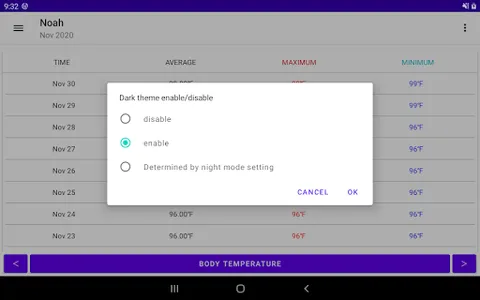
▼ How to hide the line graph
You can hide the line graph from the settings in the upper menu.
▼ How to hide the column chart
You can hide the column chart from the settings in the upper menu.
▼ Transfer model change data
Tap "Transfer model data" in the menu to display the following selection screen.
・ File creation (create backup file for model change)
・ Restore (Restore data from backup file)
Step A. How to create backup file
1. Tap "Transfer model data" in the menu.
2. Tap Create file.
3. Tap "Create file" on the confirmation screen.
4. Tap "Select app" on the send screen.
5. Tap "Save" on the drive.
* Internet connection is required to save to the drive.
Step B. Restore (Restore data from backup file in Step A)
1. Install this app on your new smartphone / tablet from google play. Launch the app.
2. Tap "Transfer model change data" in the menu.
3. Tap Restore.
4. Tap the drive.
5. Tap My Drive.
6. From the file list, tap the file you want to restore.
By tapping "Sort by" from the menu on the upper right, you can sort by "Modified (newest first)".
You can record the body temperature by specifying the date and time.
Record the daily body temperature and display it in a graph.
You can check the body temperature for each record with a line graph.
You can check the maximum body temperature / minimum body temperature / average body temperature for each month on the horizontal bar graph.
The daily average body temperature is displayed as a line graph and a bar graph.
▼ Procedure to record body temperature
1. Tap the body temperature button
2. Select the date when the body temperature was measured and tap Next
3. Select the time when the body temperature was measured and tap Next
4. Enter the measured body temperature and tap OK
5. Confirm and tap Done
▼ Note
You can take a note by selecting "Memo enable/disable" from the menu on the upper right.
▼ Body temperature bar chart
The average, maximum and minimum of body temperature for each month are displayed in a horizontal bar graph.
If you record your body temperature more than twice a month, a horizontal bar graph of body temperature will be displayed.
▼ Body temperature (for each record)
A line graph of body temperature for each record is displayed.
When you tap the title text at the top of the graph, the calendar will be displayed and you can specify the period. Display a line graph with a record of body temperature for the selected time period.
▼ Body temperature (average daily) line graph
A line graph for one month is displayed.
A line graph is displayed when there are records for 3 days or more.
▼ Body temperature column chart
Display a column graph of body temperature for one month.
Displays a column graph when there are records for 3 days or more.
▼ Check daily records
If you recorded multiple times a day, tap the daily column in the table above
Display daily page. Display a line graph at the top of the daily page.
▼ How to hide the line graph
You can hide the line graph from the settings in the upper menu.
▼ How to hide the column chart
You can hide the column chart from the settings in the upper menu.
▼ Transfer model change data
Tap "Transfer model data" in the menu to display the following selection screen.
・ File creation (create backup file for model change)
・ Restore (Restore data from backup file)
Step A. How to create backup file
1. Tap "Transfer model data" in the menu.
2. Tap Create file.
3. Tap "Create file" on the confirmation screen.
4. Tap "Select app" on the send screen.
5. Tap "Save" on the drive.
* Internet connection is required to save to the drive.
Step B. Restore (Restore data from backup file in Step A)
1. Install this app on your new smartphone / tablet from google play. Launch the app.
2. Tap "Transfer model change data" in the menu.
3. Tap Restore.
4. Tap the drive.
5. Tap My Drive.
6. From the file list, tap the file you want to restore.
By tapping "Sort by" from the menu on the upper right, you can sort by "Modified (newest first)".
Show More