CANDLESTICK PATTERN-STOCK MKT
You Dream It, We Create It.
50+
downloads
Free
About CANDLESTICK PATTERN-STOCK MKT
GOOD APP FOR CANDLESTICK PATTERN-STOCK MKT
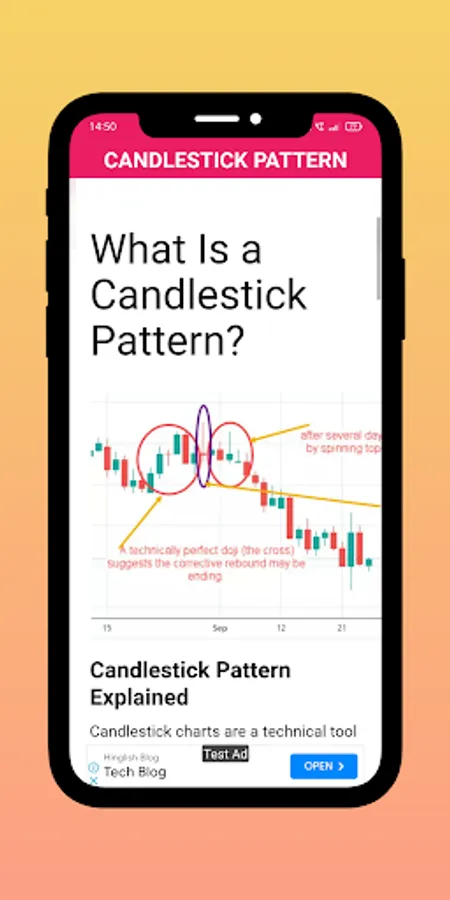
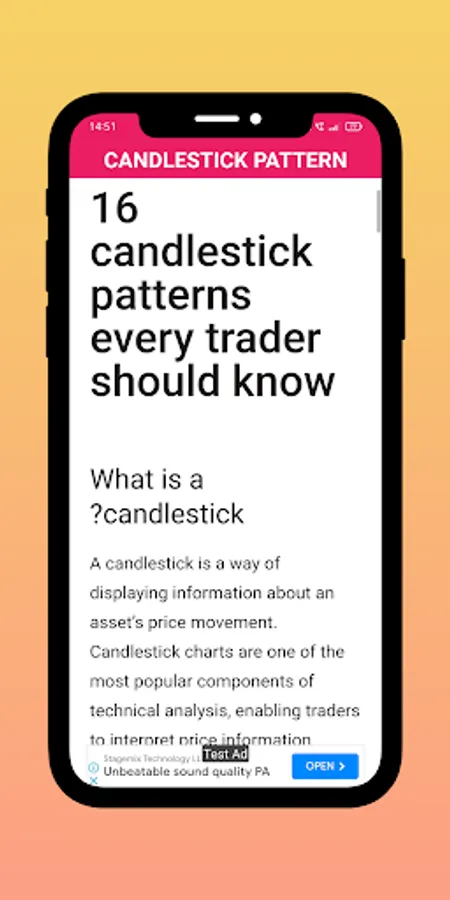
In financial technical analysis, a candlestick pattern is a movement in prices shown graphically on a candlestick chart that some believe can predict a particular market movement. The recognition of the pattern is subjective and programs that are used for charting have to rely on predefined rules to match the pattern.
Candlestick Pattern Explained
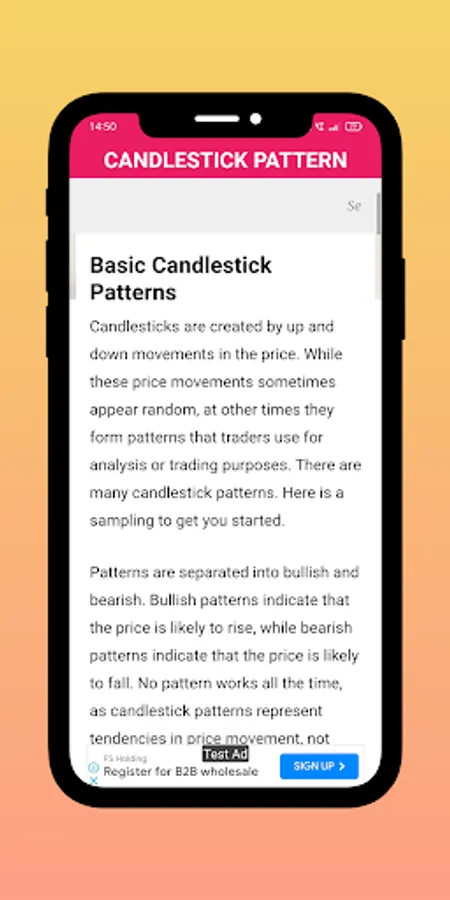
Candlestick charts are a technical tool that packs data for multiple time frames into single price bars. This makes them more useful than traditional open, high, low, close (OHLC) bars or simple lines that connect the dots of closing prices. Candlesticks build patterns that may predict price direction once completed. Proper color coding adds depth to this colorful technical tool, which dates back to 18th century Japanese rice traders.
Developed By:- You Dream It, We Create It.
Contact US:- swatidoke96@gmail.com
In financial technical analysis, a candlestick pattern is a movement in prices shown graphically on a candlestick chart that some believe can predict a particular market movement. The recognition of the pattern is subjective and programs that are used for charting have to rely on predefined rules to match the pattern.
Candlestick Pattern Explained
Candlestick charts are a technical tool that packs data for multiple time frames into single price bars. This makes them more useful than traditional open, high, low, close (OHLC) bars or simple lines that connect the dots of closing prices. Candlesticks build patterns that may predict price direction once completed. Proper color coding adds depth to this colorful technical tool, which dates back to 18th century Japanese rice traders.
Developed By:- You Dream It, We Create It.
Contact US:- swatidoke96@gmail.com
CANDLESTICK PATTERN-STOCK MKT Screenshots


Tap to Rate: