About Chart Pattern | Stock Market
A chart pattern or price pattern is a pattern within a chart when prices are graphed. In stock and commodity markets trading, chart pattern studies play a large role during technical analysis. When data is plotted there is usually a pattern which naturally occurs and repeats over a period.
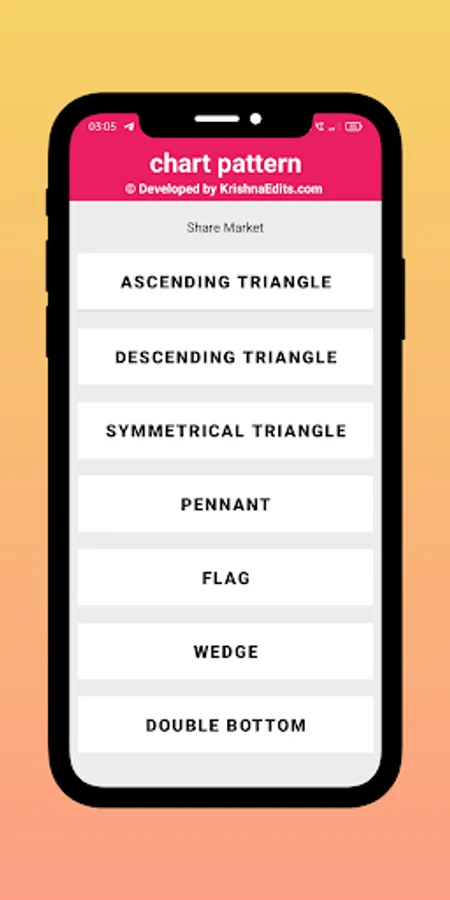
In This App
A chart pattern is a shape within a price chart that helps to suggest what prices might do next, based on what they have done in the past. Chart patterns are the basis of technical analysis and require a trader to know exactly what they are looking at, as well as what they are looking for.
Developed By:- Krishna_Edits
Contact US:- dattatraydoke96@gmail.com
Best Of Luck