FinanceCharts.com
FinanceCharts.com
3.9 ★
36 ratings
1,000+
downloads
Free
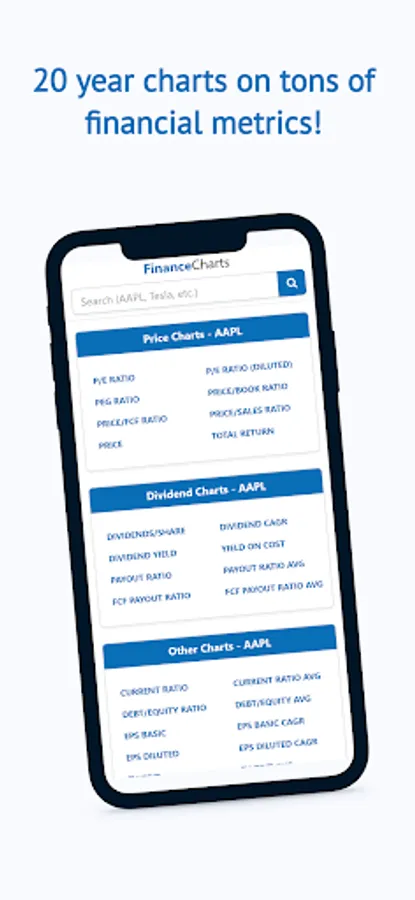
With this financial data app, you can access 20-year charts on various metrics for public companies and compare multiple firms. Includes stock screeners, dividend tools, price and dividend charts, and valuation calculators.
AppRecs review analysis
AppRecs rating 3.9. Trustworthiness 80 out of 100. Review manipulation risk 29 out of 100. Based on a review sample analyzed.
★★★☆☆
3.9
AppRecs Rating
Ratings breakdown
5 star
65%
4 star
9%
3 star
0%
2 star
9%
1 star
18%
What to know
✓
Low review manipulation risk
29% review manipulation risk
✓
Credible reviews
80% trustworthiness score from analyzed reviews
✓
Good user ratings
74% positive sampled reviews
About FinanceCharts.com
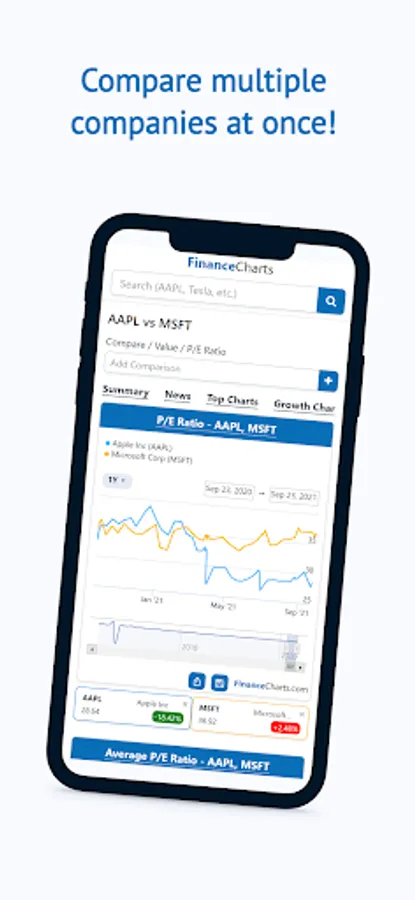
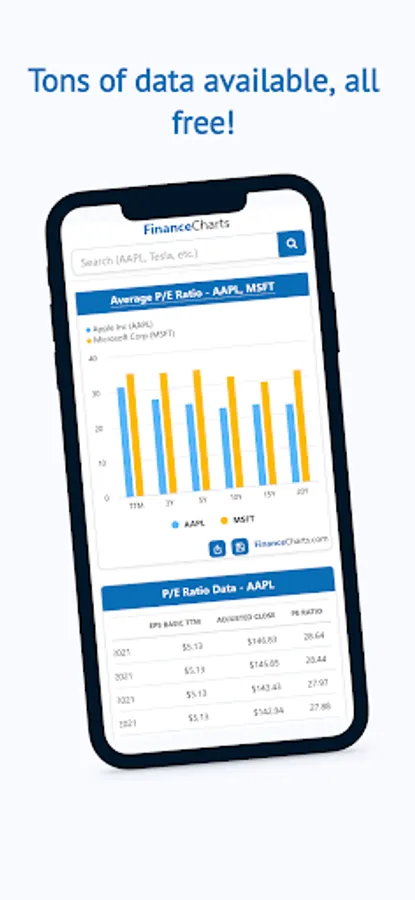
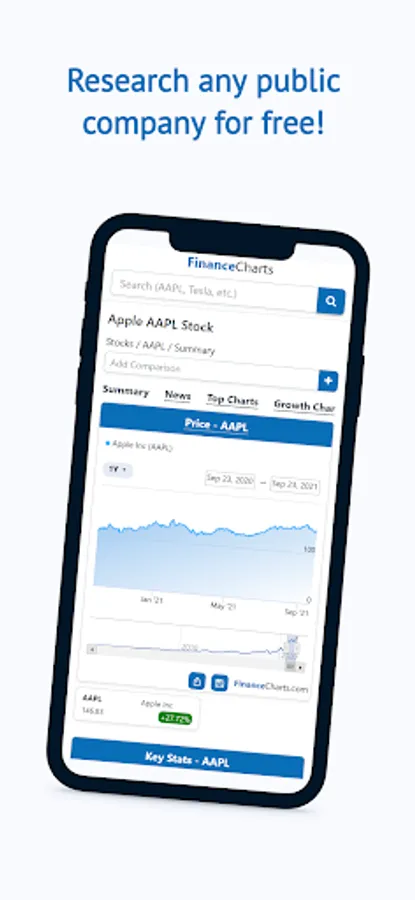
The search for value has just gotten easier. 20 year charts on nearly any financial metric for every public company. Compare multiple companies at once. Easy, fast and 100% free.
Powered by FinanceCharts.com.
Popular Screeners:
- Most Profitable
- Best Performing
- Worst Performing
- 52-Week Highs
- 52-Week Lows
- Biggest Gainers
- Biggest Losers
- Biggest Companies
- S&P 500 Companies
- New IPOs
- High Growth
Dividend Screeners:
- Top Dividend Stocks
- Highest Yielding
- Dividend Growth
- Dividend Kings
- Dividend Aristocrats
- Dividend Challengers
- Dividend Contenders
Value Screeners:
- Best Value Stocks
- Cheapest
- Most Expensive
- Undervalued (DCF)
- Undervalued (DCF w/Earnings)
- Overvalued (DCF)
- Overvalued (DCF w/Earnings)
Price Charts:
- P/E RATIO
- PEG RATIO
- PRICE/BOOK RATIO
- PRICE/FCF RATIO
- PRICE/SALES RATIO
- TOTAL RETURN
Dividend Charts:
- DIVIDENDS/SHARE
- DIVIDEND CAGR
- DIVIDEND YIELD
- YIELD ON COST
- PAYOUT RATIO
- FCF PAYOUT RATIO
Other Charts:
- CURRENT RATIO
- DEBT/EQUITY RATIO
- EPS BASIC
- EPS DILUTED
- EV/EBIT
- EV/EBITDA
- EV/ASSETS
- EV/SALES
- FREE CASH FLOW
- NET INCOME
- PROFIT MARGIN
- QUICK RATIO
- ROA
- ROE
- REVENUE
- Discounted Cash Flow Calculator
See the fair value price for any stock.