Easy to use! Investment tools
An integrated investment tool that allows you to easily perform backtesting, portfolio optimization, risk analysis and more.
Main functions:
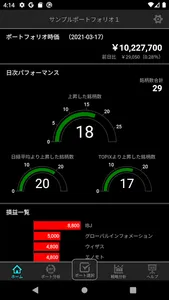
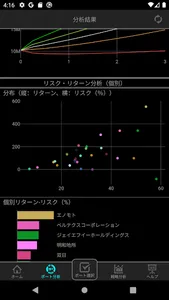
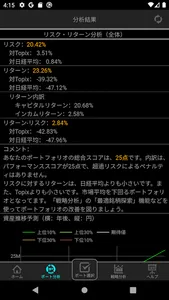
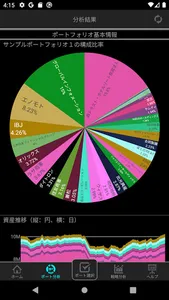
Portfolio / individual stock risk / return analysis
Return including dividend yield can also be calculated
Comparison function with Topix and Nikkei 225
Portfolio scoring function
Risk / return contribution analysis by brand
Calculate the contribution of each stock to the risk, return, and dividend yield of the entire portfolio
Displayed in an easy-to-understand graph
Financial information analysis
Calculate market capitalization, PER, PBR, ROE, ROA, and capital adequacy ratio when the portfolio is regarded as one company
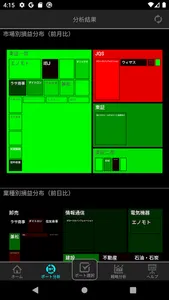
Break-even distribution analysis
Displayed in an easy-to-see treemap for profit and loss by market and industry
At a glance, you can see which industry has the highest return, etc.
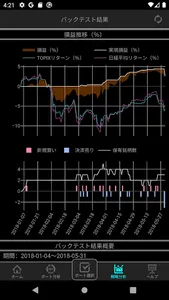
Back test (charged)
You can test your own strategy using a total of more than 2.5 million historical data. You can verify your strategy with only easy-to-understand GUI operations without difficult programming. In addition to the four prices, time-series financial information can also be used.
Custom signal (charged)
It is a signal confirmation function that is optimal for strategy operation.
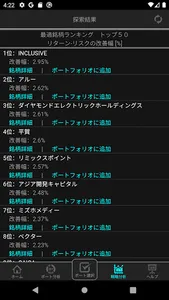
Search for the best stock (charged)
Automatically extract the most suitable stock for the current portfolio based on price fluctuation information. With filter function by PER, PBR, market capitalization, ROE, ROA, capital adequacy ratio
Scenario test (charged)
Simulate how the financial crisis or war that occurred in the past will affect the portfolio if it occurs now.
An integrated investment tool that allows you to easily perform backtesting, portfolio optimization, risk analysis and more.
Main functions:
Portfolio / individual stock risk / return analysis
Return including dividend yield can also be calculated
Comparison function with Topix and Nikkei 225
Portfolio scoring function
Risk / return contribution analysis by brand
Calculate the contribution of each stock to the risk, return, and dividend yield of the entire portfolio
Displayed in an easy-to-understand graph
Financial information analysis
Calculate market capitalization, PER, PBR, ROE, ROA, and capital adequacy ratio when the portfolio is regarded as one company
Break-even distribution analysis
Displayed in an easy-to-see treemap for profit and loss by market and industry
At a glance, you can see which industry has the highest return, etc.
Back test (charged)
You can test your own strategy using a total of more than 2.5 million historical data. You can verify your strategy with only easy-to-understand GUI operations without difficult programming. In addition to the four prices, time-series financial information can also be used.
Custom signal (charged)
It is a signal confirmation function that is optimal for strategy operation.
Search for the best stock (charged)
Automatically extract the most suitable stock for the current portfolio based on price fluctuation information. With filter function by PER, PBR, market capitalization, ROE, ROA, capital adequacy ratio
Scenario test (charged)
Simulate how the financial crisis or war that occurred in the past will affect the portfolio if it occurs now.
Show More