About Graph It Money
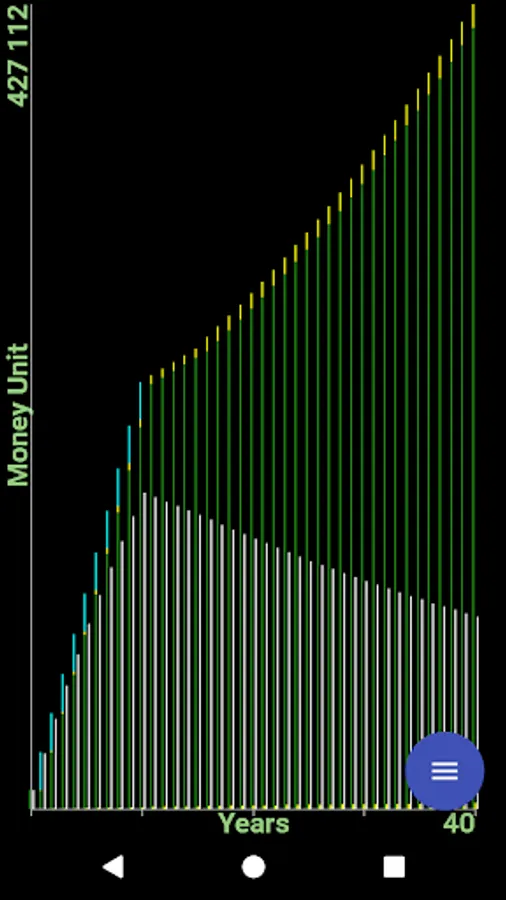
Graphically show how your money will last, whether it is savings, income or such as lottery winnings. You estimate how that money can gain each year with interest or return on that money, and income or additions. You can input how that money is reduced each year. This can be withdraw, expenses and taxes on investment return and taxes on income.
The graph will display results until a user input Maximum-Years, or the total money becomes zero.
All values are annual values. So, for example, Withdraw is the total estimated withdraw for a year.
An estimate of inflation can be applied with options of increasing such as withdraw and additions to account for inflation. Also inflation is applied to show what the current money amount is worth relative to year zero on the graph.
Graph It Money Screenshots
Tap to Rate: