QSROnline Reporting
QSROnline.com, Inc.
3.9 ★
store rating
1,000+
downloads
Free
AppRecs review analysis
AppRecs rating 3.4. Trustworthiness 59 out of 100. Review manipulation risk 35 out of 100. Based on a review sample analyzed.
★★★☆☆
3.4
AppRecs Rating
Ratings breakdown
5 star
70%
4 star
5%
3 star
0%
2 star
10%
1 star
15%
What to know
✓
Good user ratings
75% positive sampled reviews
About QSROnline Reporting
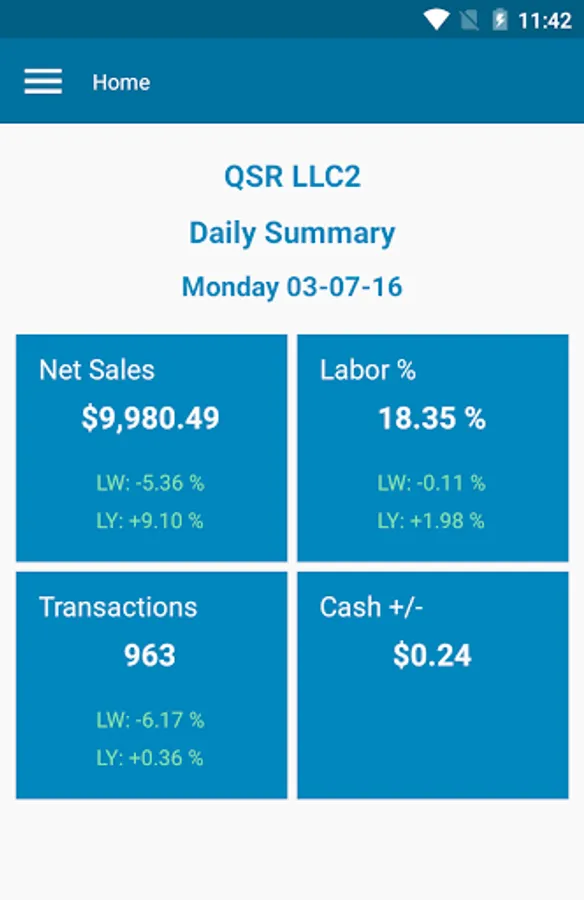
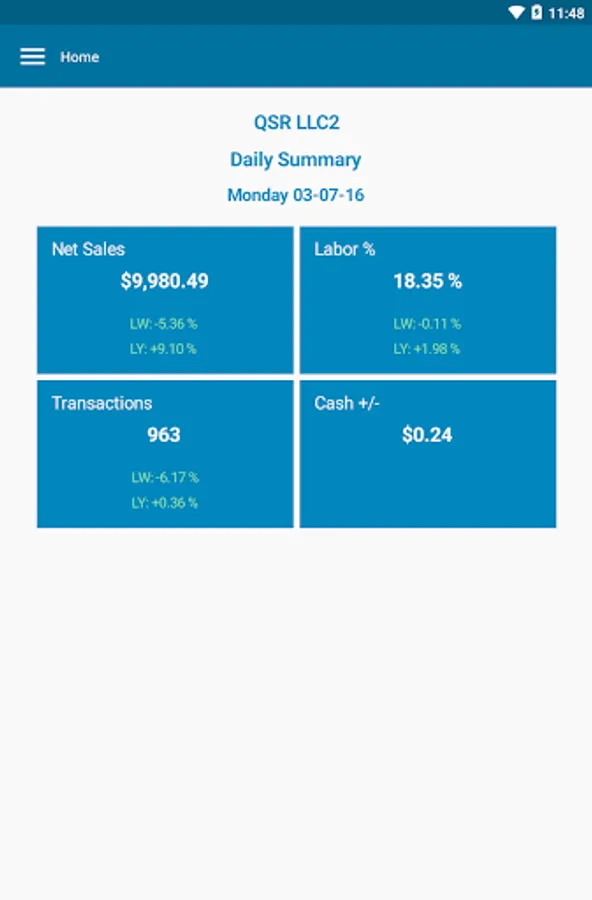
View your most informative reports anytime, anywhere with QSROnline's Reporting App! Login and immediately get a quick recap of Net Sales, Labor Percentage, Transaction Numbers, and Cash+/- compared to last week and last year.
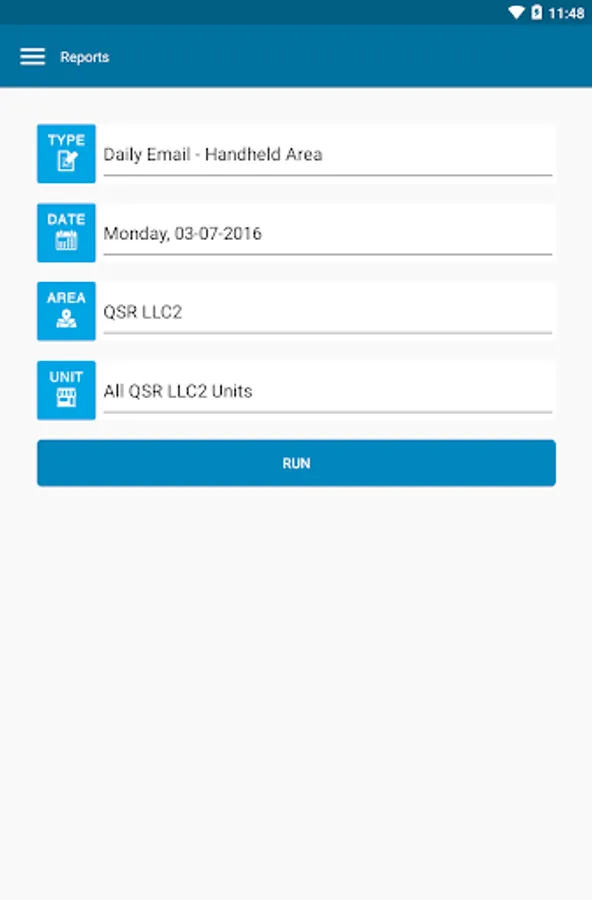
View up to four reports:
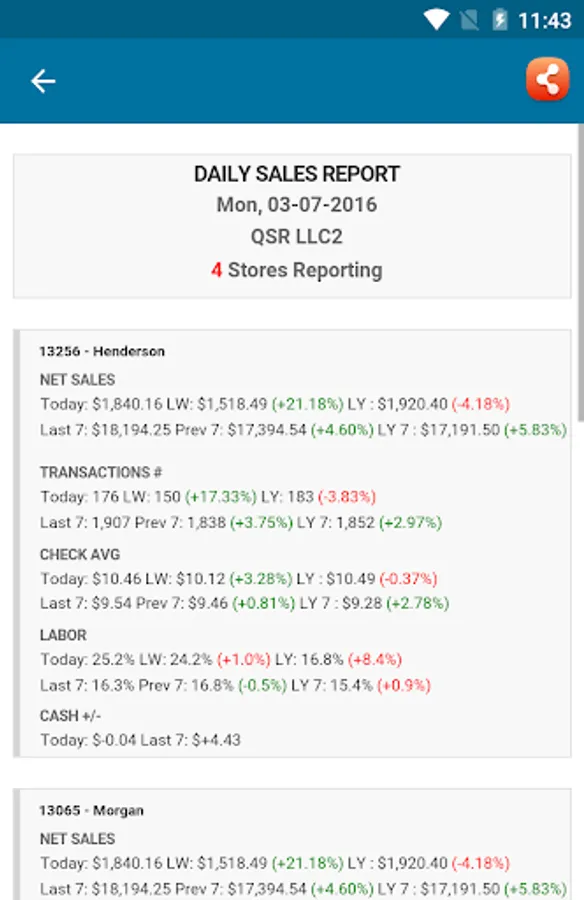
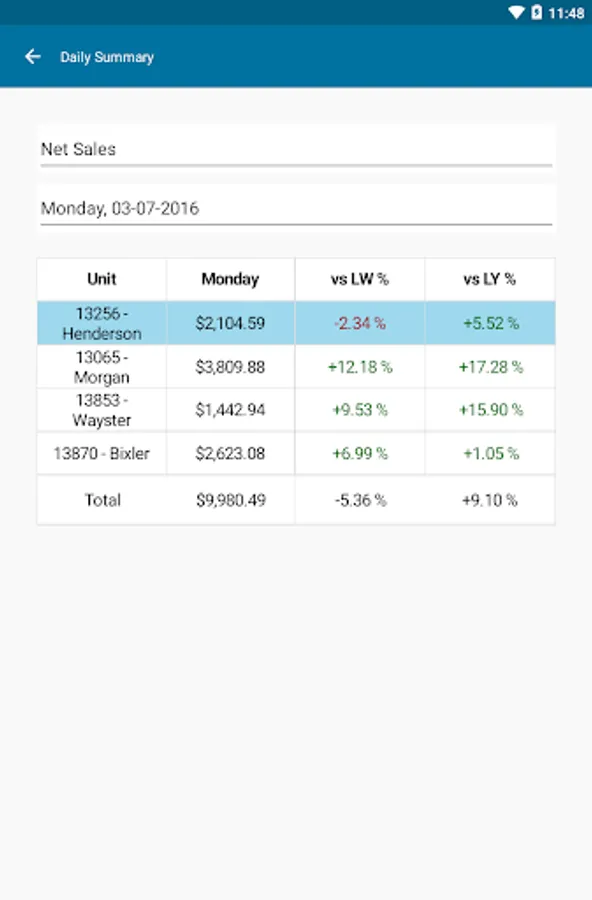
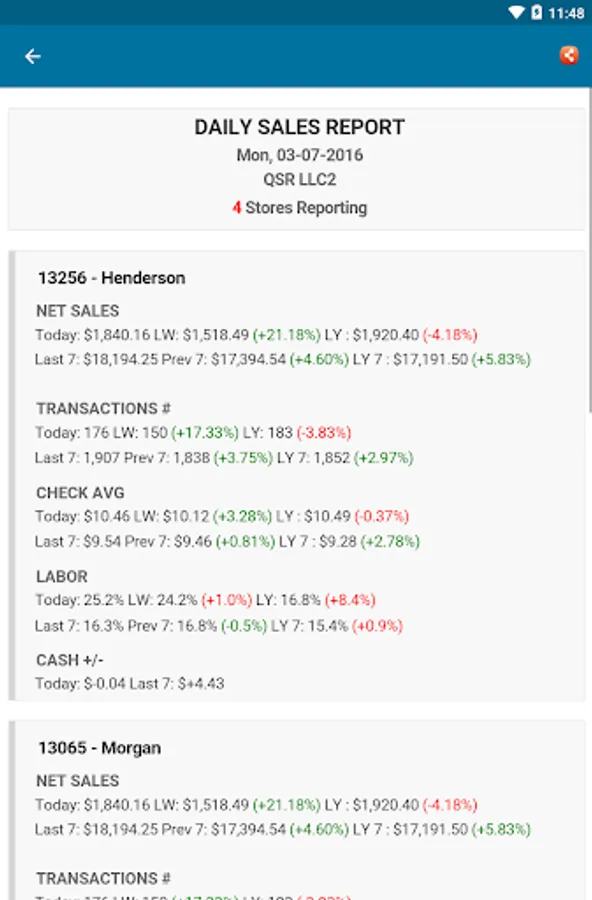
1. Daily Sales Report: Needing a simple snapshot of your profitability? This report lists Net Sales, Number of Transactions, Check Averages, Labor Percentages, and Cash +/- for each store location. Compare today’s figures to those of last week and the week prior. Color-coded numbers easily identify percentage changes for each category.
2. Top Selling Menu Items - By Sales Report: Quickly determine which menu items are earning you the most profit. View the Top 10 Selling Menu Items, along with their total profits earned and net sales percentage.
3. Clock In - Clock Out Exceptions Report: View which employees clocked in early or clocked out late to their shifts (and how much money their extra minutes/hours on the clock cost you). Also compare actual labor to scheduled labor.
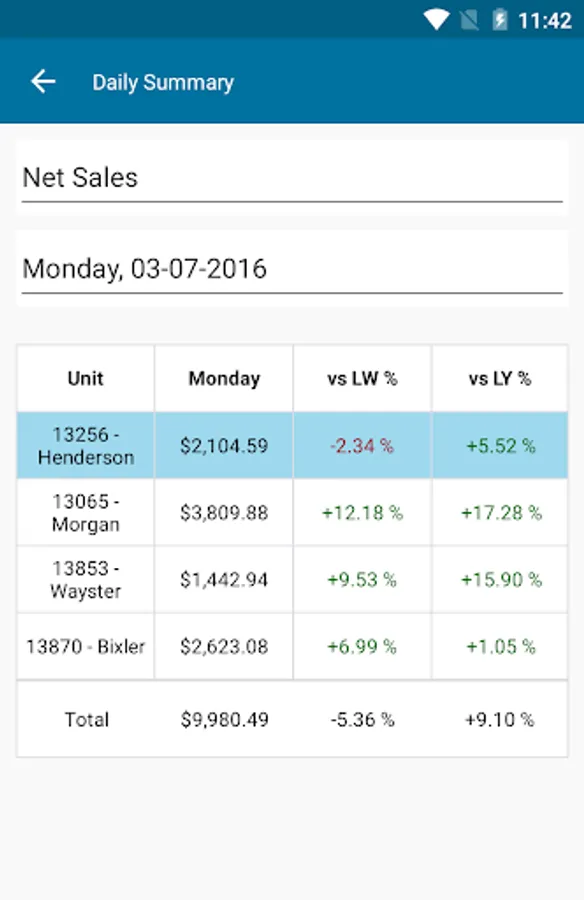
4. Unit Comparison Report: Easily compare sales across stores. This color-coded report allows you to track stores’ progress throughout the year, and identify your most profitable locations.
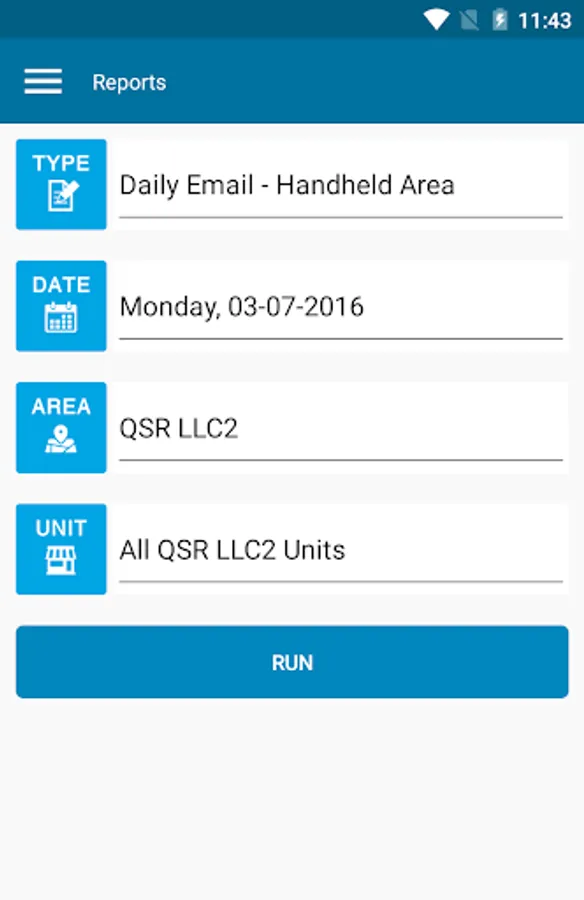
You must be a QSROnline customer to take full advantage of this application. However, you can try a FREE trial version of the app today! The free trial version is fully functional and allows you to interact with the app and view all included reports.
QSROnline Reporting supports Android 2.3 or higher.
Have questions, problems, or feedback? Reach out to us at support@qsronline.com
View up to four reports:
1. Daily Sales Report: Needing a simple snapshot of your profitability? This report lists Net Sales, Number of Transactions, Check Averages, Labor Percentages, and Cash +/- for each store location. Compare today’s figures to those of last week and the week prior. Color-coded numbers easily identify percentage changes for each category.
2. Top Selling Menu Items - By Sales Report: Quickly determine which menu items are earning you the most profit. View the Top 10 Selling Menu Items, along with their total profits earned and net sales percentage.
3. Clock In - Clock Out Exceptions Report: View which employees clocked in early or clocked out late to their shifts (and how much money their extra minutes/hours on the clock cost you). Also compare actual labor to scheduled labor.
4. Unit Comparison Report: Easily compare sales across stores. This color-coded report allows you to track stores’ progress throughout the year, and identify your most profitable locations.
You must be a QSROnline customer to take full advantage of this application. However, you can try a FREE trial version of the app today! The free trial version is fully functional and allows you to interact with the app and view all included reports.
QSROnline Reporting supports Android 2.3 or higher.
Have questions, problems, or feedback? Reach out to us at support@qsronline.com