Chart AI - Trading AI Analysis
Indie Mobile Apps
5,000+
downloads
Free
+ in-app
AppRecs review analysis
AppRecs rating 3.2. Trustworthiness 70 out of 100. Review manipulation risk 42 out of 100. Based on a review sample analyzed.
★★★☆☆
3.2
AppRecs Rating
Ratings breakdown
5 star
77%
4 star
10%
3 star
3%
2 star
0%
1 star
10%
What to know
⚠
Questionable review patterns
42% review manipulation risk - some review patterns appear unusual
⚠
Limited rating diversity
87% high ratings in sampled reviews
⚠
Review quality concerns
83% of sampled 5-star reviews are very short
About Chart AI - Trading AI Analysis
Analyze trading charts instantly with AI-powered pattern detection and educational insights. Chart AI helps you understand chart structures, identify key zones, and improve your technical analysis skills.
Upload any stock, crypto, or forex chart and receive structured breakdowns of patterns, support and resistance zones. Designed for learners developing analysis skills and traders seeking educational interpretations and not financial advice.
KEY FEATURES
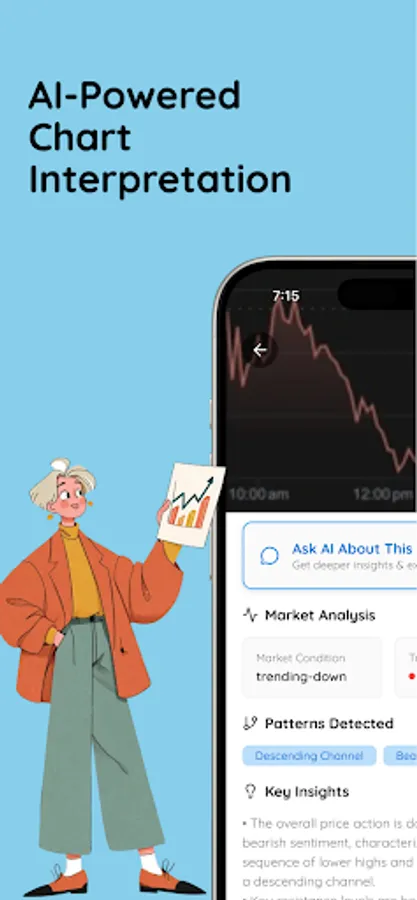
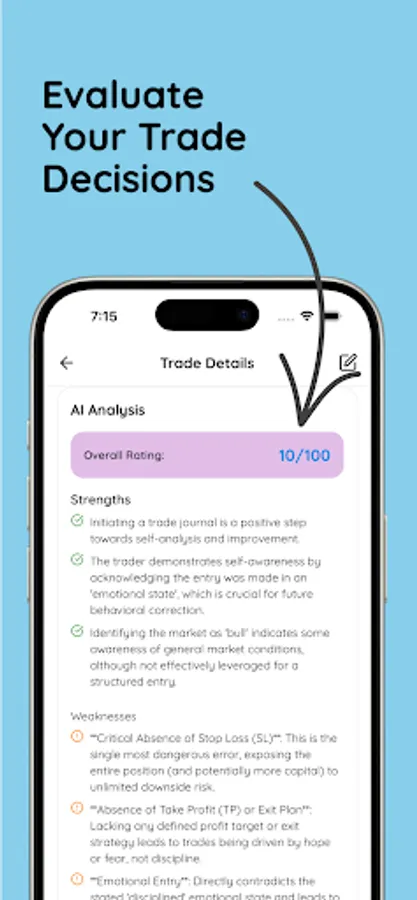
• Instant Chart Interpretation
Upload screenshots or images of trading charts and receive structured breakdowns in seconds.
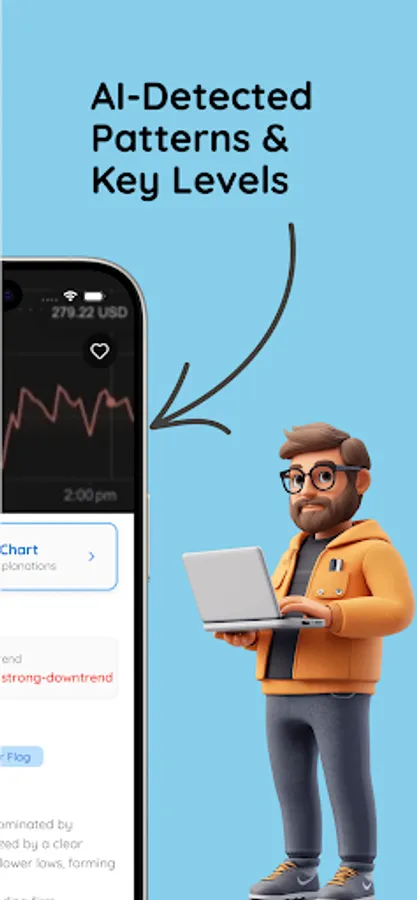
• Pattern Detection
Automatically highlight common chart structures such as head & shoulders, triangles, flags, wedges, double tops, divergences, and more.
• Target Zone Estimation
AI provides educational estimates of possible price zones based on historical technical patterns. (Not predictive/guaranteed)
• Support & Resistance Mapping
View likely levels where price historically reacts, consolidates, or changes direction.
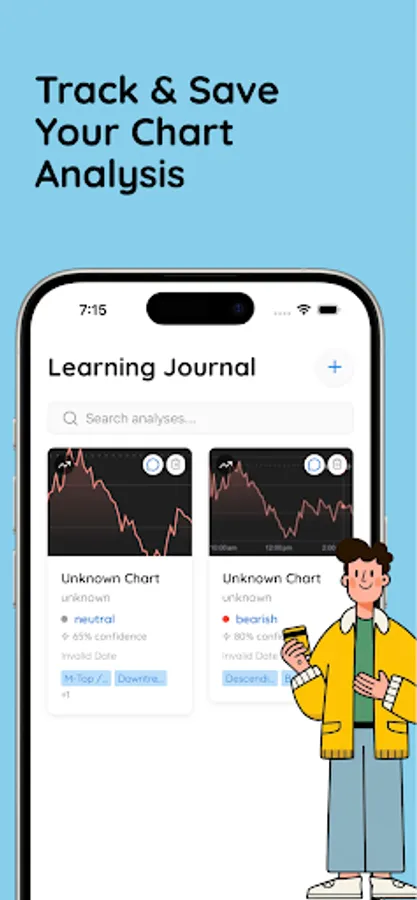
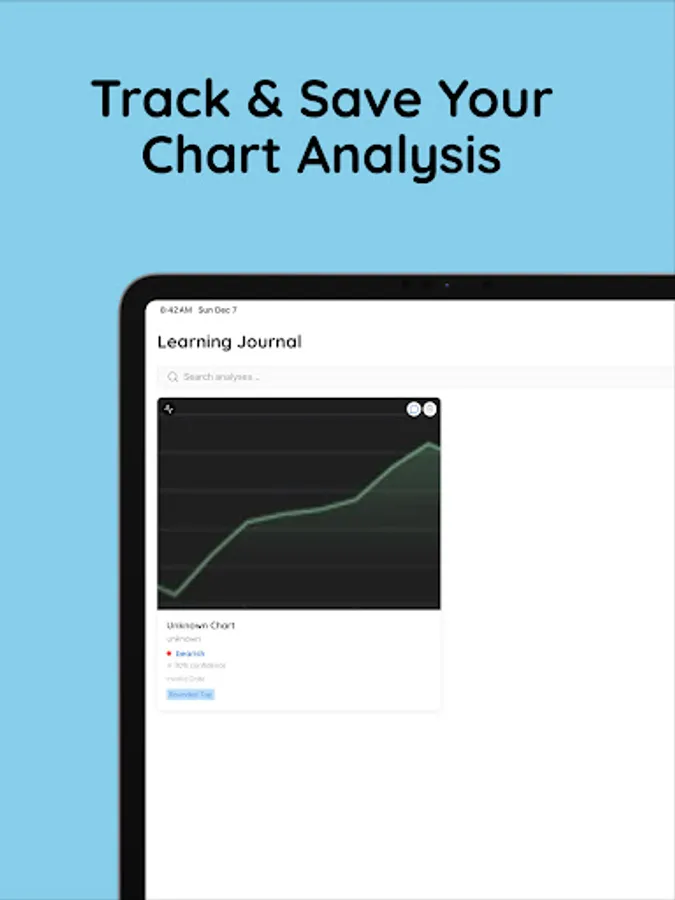
• Learning Journal
Save your chart breakdowns, revisit them later, and learn how patterns developed over time.
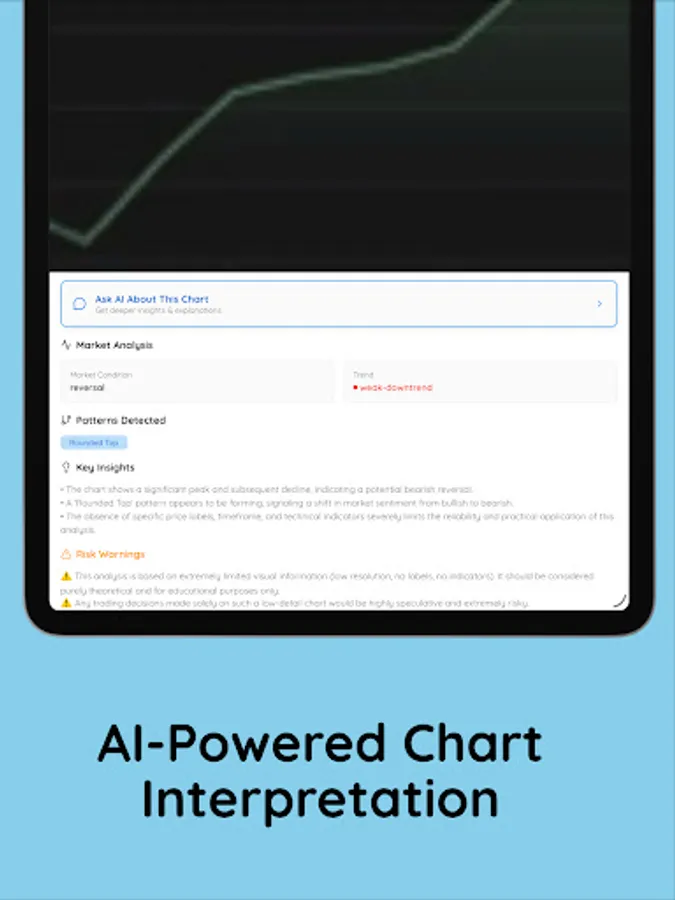
• Market Structure Overview
View trend direction, momentum analysis, pattern importance, and key structural movements.
• Multi-Asset Compatible
Works with stock charts, crypto charts, forex, commodities, and index screenshots from any charting platform.
WHO CAN USE IT
• Beginners
Learn why patterns matter and how analysts interpret charts.
• Students & Educators
Use real chart snapshots to study market behavior.
• Experienced Traders
Review AI-assisted breakdowns as an educational second opinion.
• Swing, Crypto, and Short-Term Traders
Use educational insights to study structure over different timeframes.
HOW IT WORKS
Upload a Chart Screenshot
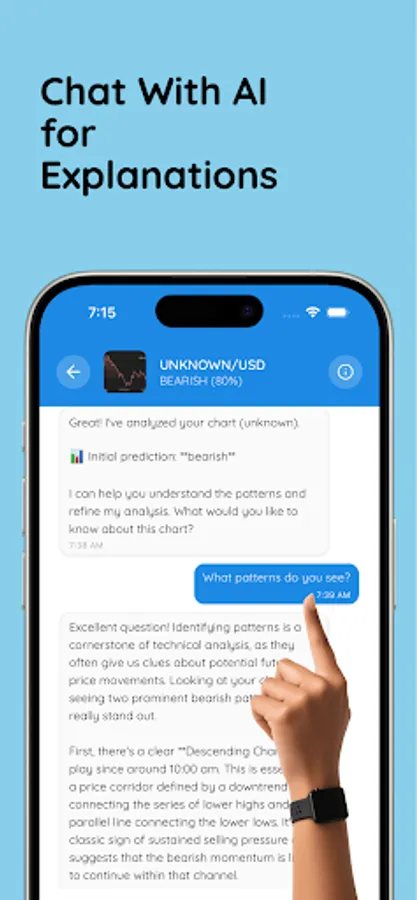
Receive AI-Based Interpretation
Patterns, levels, zones, and structural readings are detected automatically.
Review Contextual Insights
Understand why patterns are meaningful, how trends work, and how chart structures evolve.
Track Your Learning Journey
Use the journal to see how past setups played out.
LEARN TECHNICAL ANALYSIS VISUALLY
Chart AI is built primarily for educational learning. Every interpretation includes reasoning and explanations so users understand:
• Why patterns are important
• How key levels influence decisions
• How trends and momentum shift
This accelerates improving real-world chart reading skills.
IMPORTANT NOTICE
This app does not guarantee market predictions or financial outcomes.
It should be used only for educational learning and analysis reference.
Always verify information independently before making trading decisions.
No financial advice is provided.
Upload any stock, crypto, or forex chart and receive structured breakdowns of patterns, support and resistance zones. Designed for learners developing analysis skills and traders seeking educational interpretations and not financial advice.
KEY FEATURES
• Instant Chart Interpretation
Upload screenshots or images of trading charts and receive structured breakdowns in seconds.
• Pattern Detection
Automatically highlight common chart structures such as head & shoulders, triangles, flags, wedges, double tops, divergences, and more.
• Target Zone Estimation
AI provides educational estimates of possible price zones based on historical technical patterns. (Not predictive/guaranteed)
• Support & Resistance Mapping
View likely levels where price historically reacts, consolidates, or changes direction.
• Learning Journal
Save your chart breakdowns, revisit them later, and learn how patterns developed over time.
• Market Structure Overview
View trend direction, momentum analysis, pattern importance, and key structural movements.
• Multi-Asset Compatible
Works with stock charts, crypto charts, forex, commodities, and index screenshots from any charting platform.
WHO CAN USE IT
• Beginners
Learn why patterns matter and how analysts interpret charts.
• Students & Educators
Use real chart snapshots to study market behavior.
• Experienced Traders
Review AI-assisted breakdowns as an educational second opinion.
• Swing, Crypto, and Short-Term Traders
Use educational insights to study structure over different timeframes.
HOW IT WORKS
Upload a Chart Screenshot
Receive AI-Based Interpretation
Patterns, levels, zones, and structural readings are detected automatically.
Review Contextual Insights
Understand why patterns are meaningful, how trends work, and how chart structures evolve.
Track Your Learning Journey
Use the journal to see how past setups played out.
LEARN TECHNICAL ANALYSIS VISUALLY
Chart AI is built primarily for educational learning. Every interpretation includes reasoning and explanations so users understand:
• Why patterns are important
• How key levels influence decisions
• How trends and momentum shift
This accelerates improving real-world chart reading skills.
IMPORTANT NOTICE
This app does not guarantee market predictions or financial outcomes.
It should be used only for educational learning and analysis reference.
Always verify information independently before making trading decisions.
No financial advice is provided.