Vernier Go Wireless
Vernier Science Education
2.5 ★
11 ratings
1,000+
downloads
Free
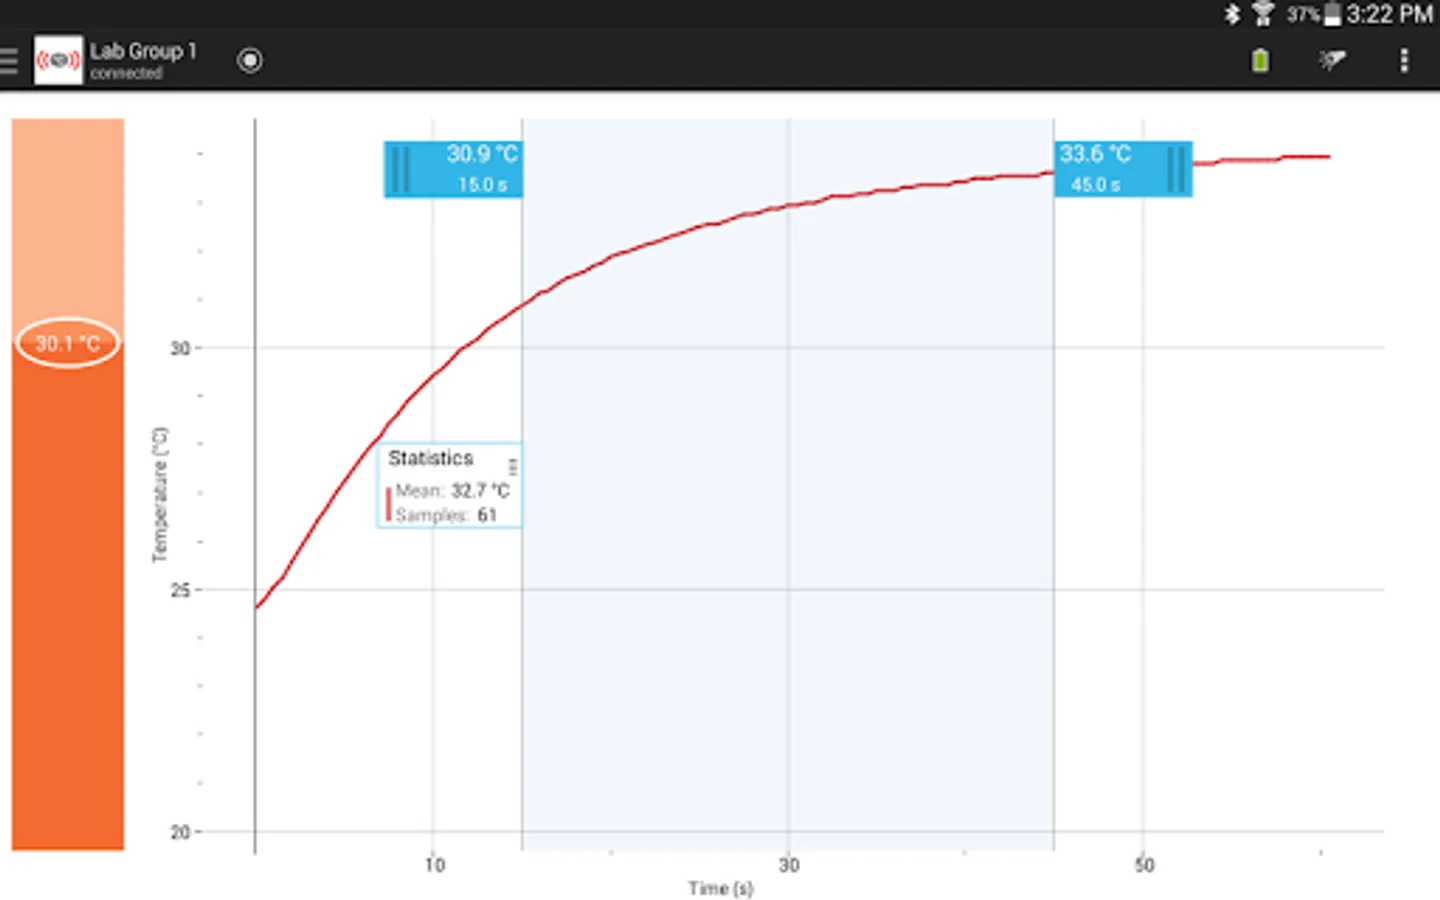
In this app, you can connect to Go Wireless Temp probes and collect temperature data displayed in graphs. Includes sensor discovery, data export as CSV, and basic statistical analysis.
AppRecs review analysis
AppRecs rating 2.5. Trustworthiness 48 out of 100. Review manipulation risk 30 out of 100. Based on a review sample analyzed.
★★☆☆☆
2.5
AppRecs Rating
Ratings breakdown
5 star
27%
4 star
0%
3 star
0%
2 star
9%
1 star
64%
What to know
⚠
Mixed user feedback
Average 2.5★ rating suggests room for improvement
About Vernier Go Wireless
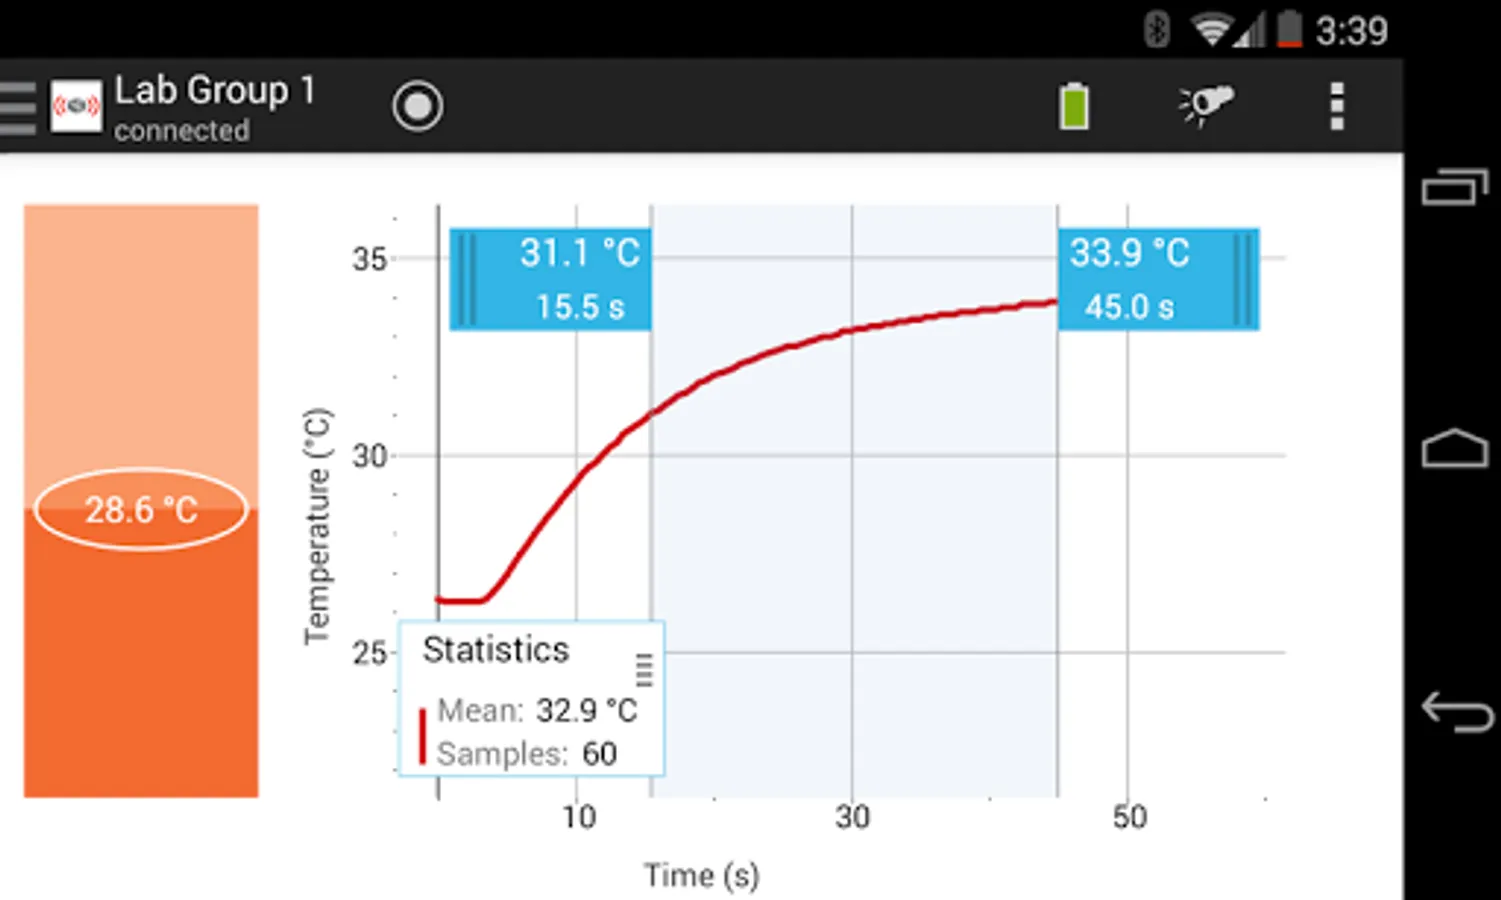
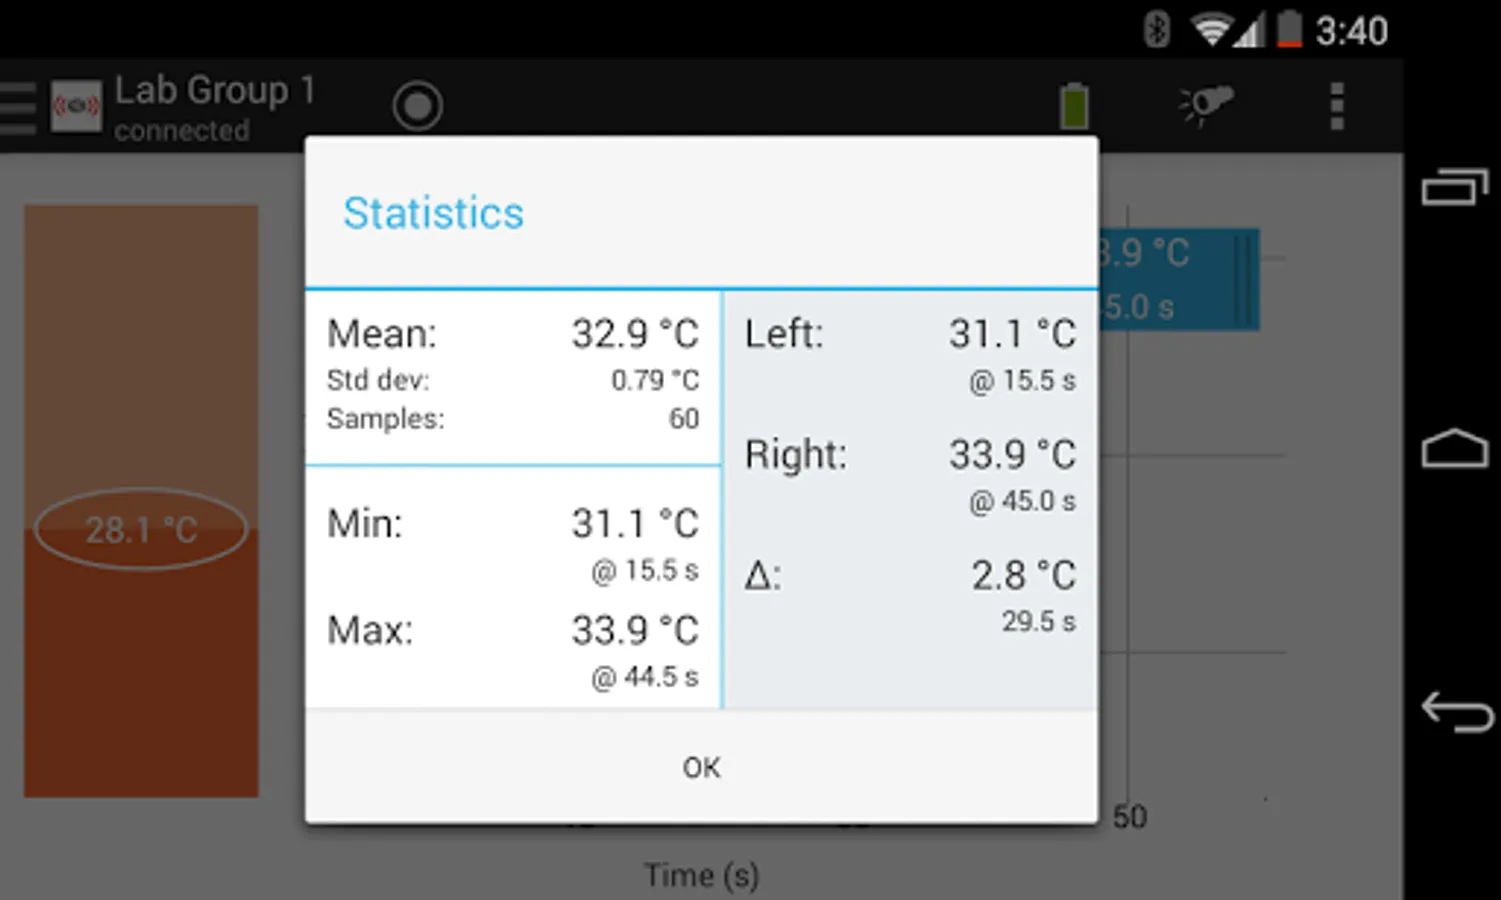
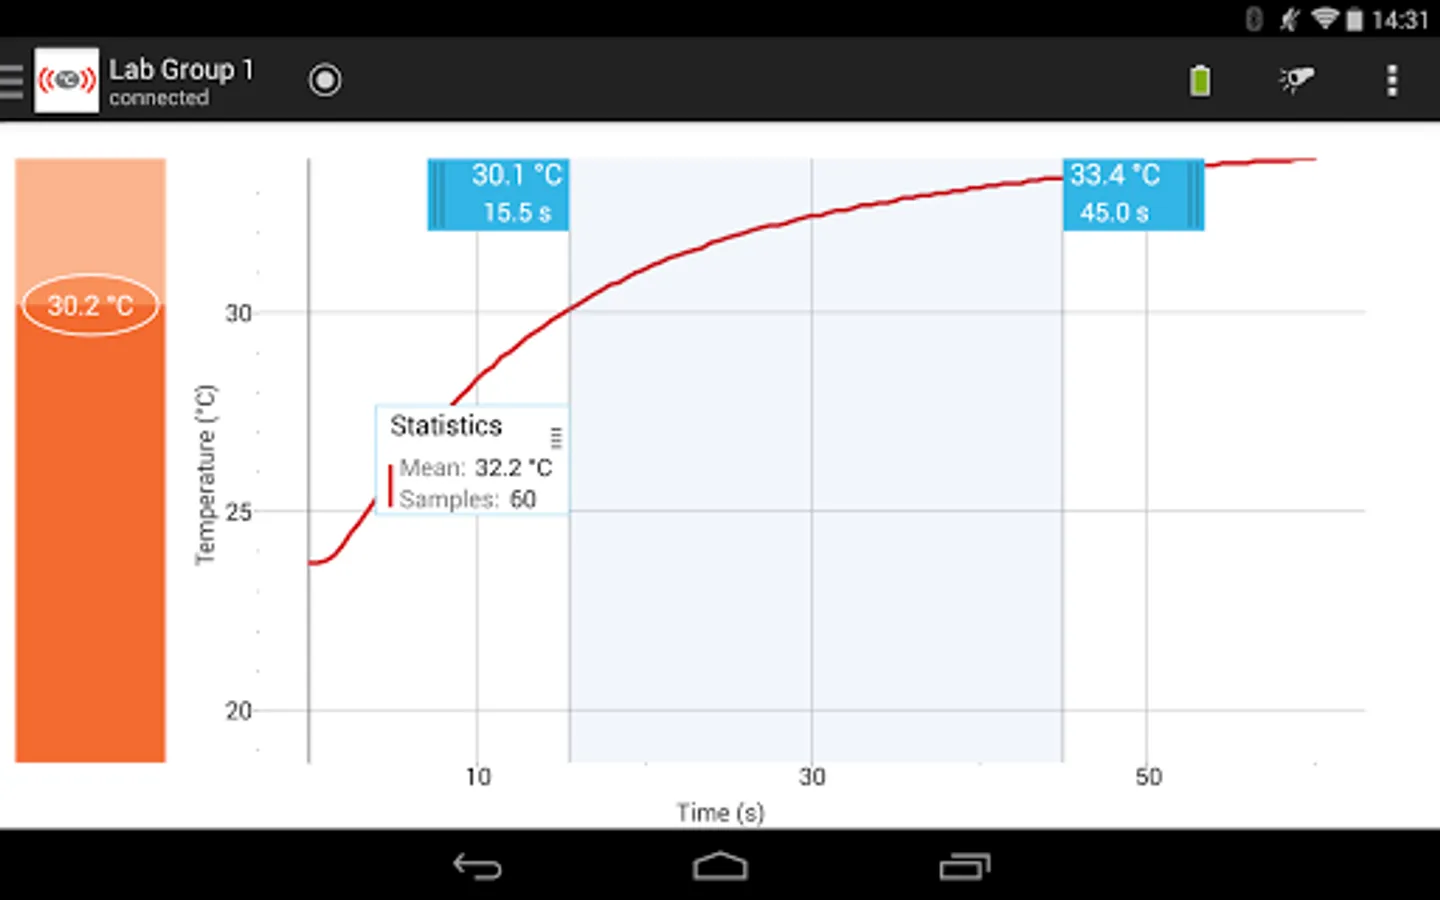
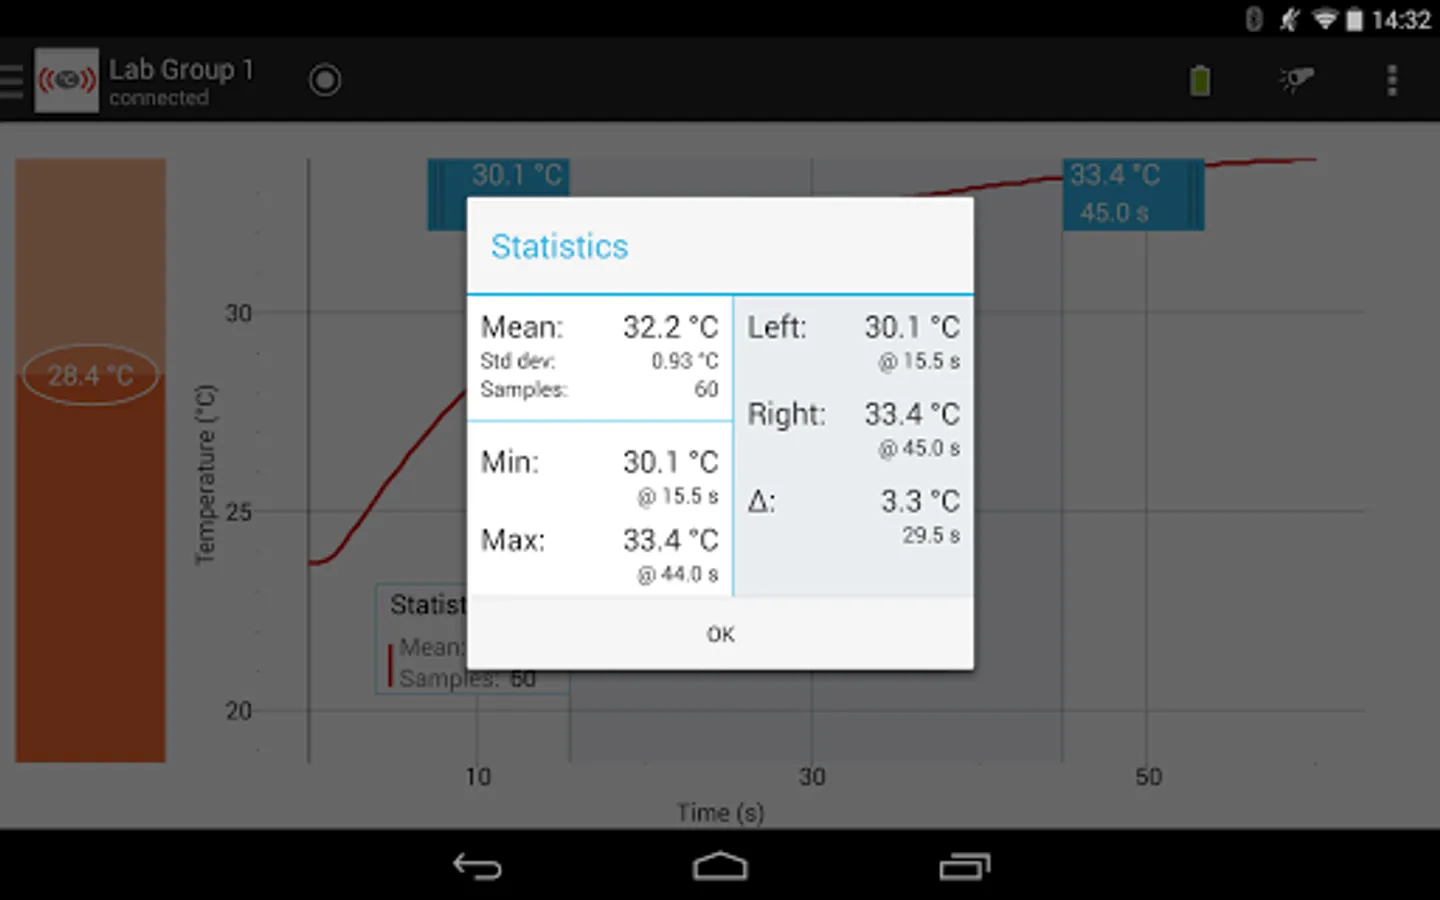
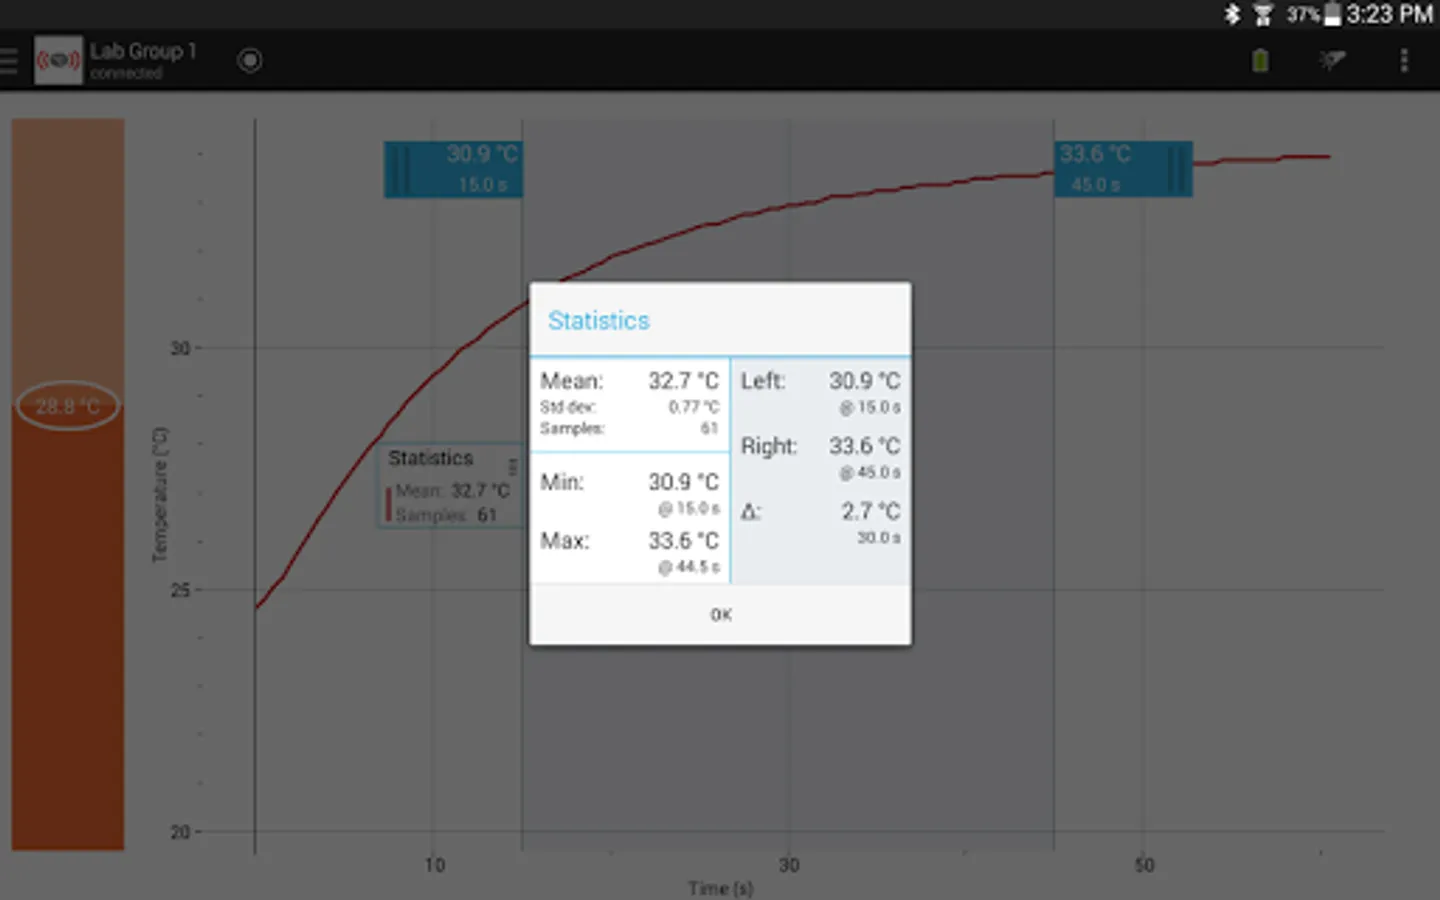
The Vernier Go Wireless app allows users to conduct experiments using Go Wireless Temp, a wireless temperature probe. Users collect temperature data that is displayed in a graph and can calculate basic statistics on a region of data. Additionally, users can export the data as a CSV file for use in other applications for even more analysis.
HARDWARE REQUIRED - Vernier Go Wireless Temp is required to make use of this application. Visit http://www.vernier.com/gw-temp for more information.
Features when using a Go Wireless Temp
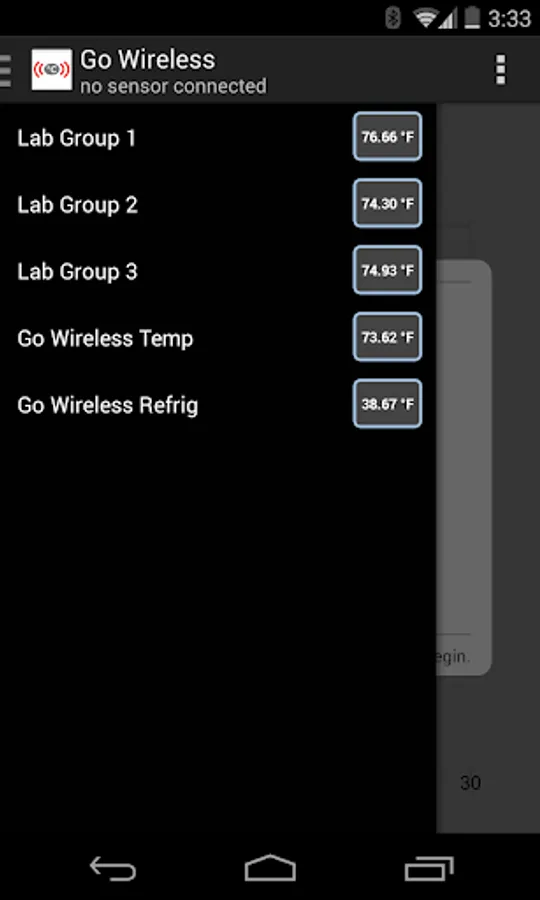
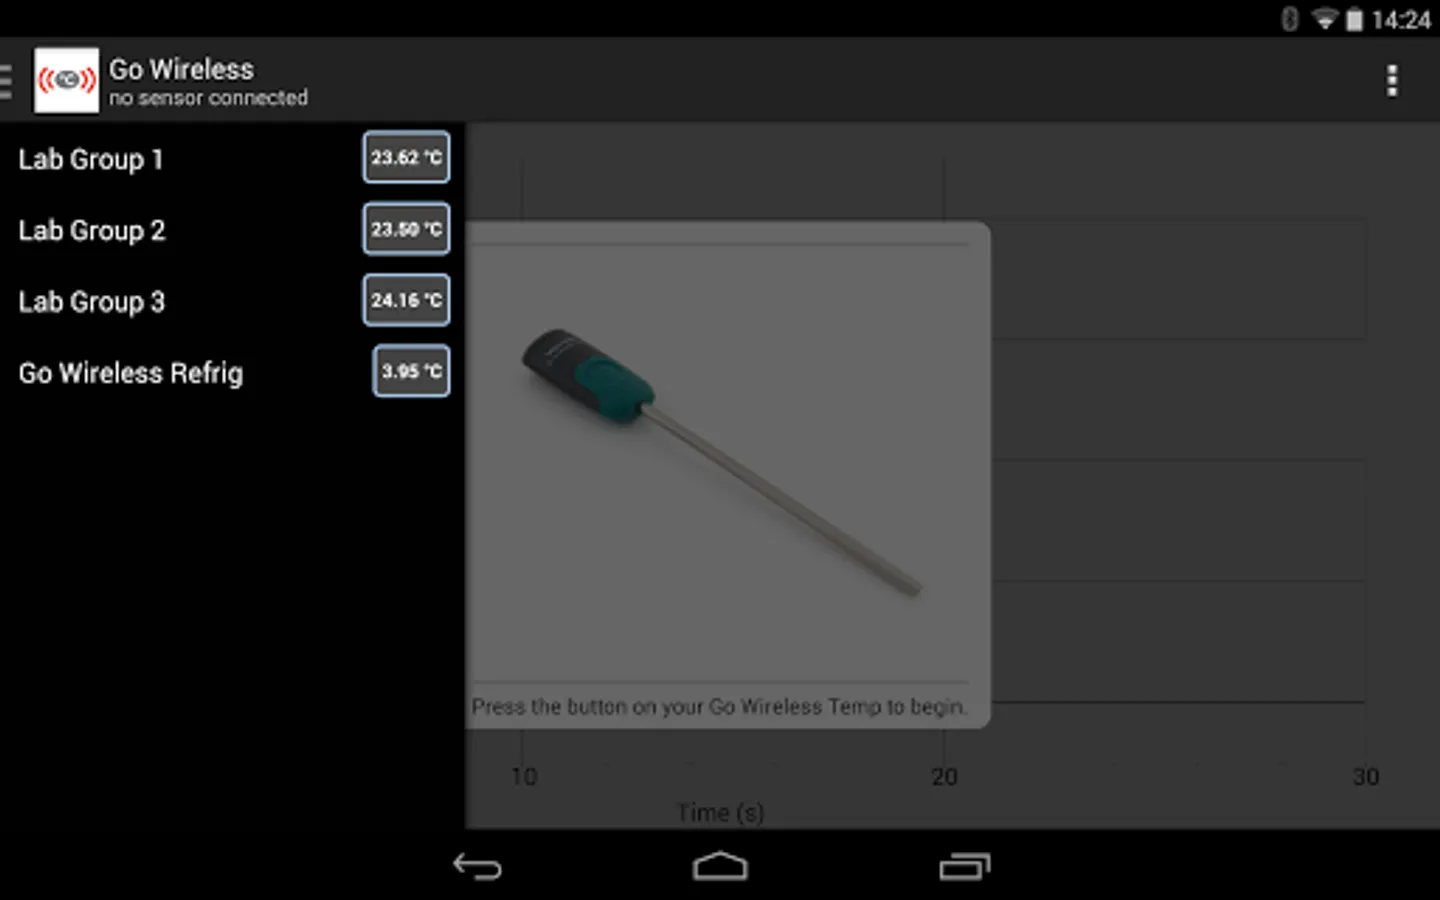
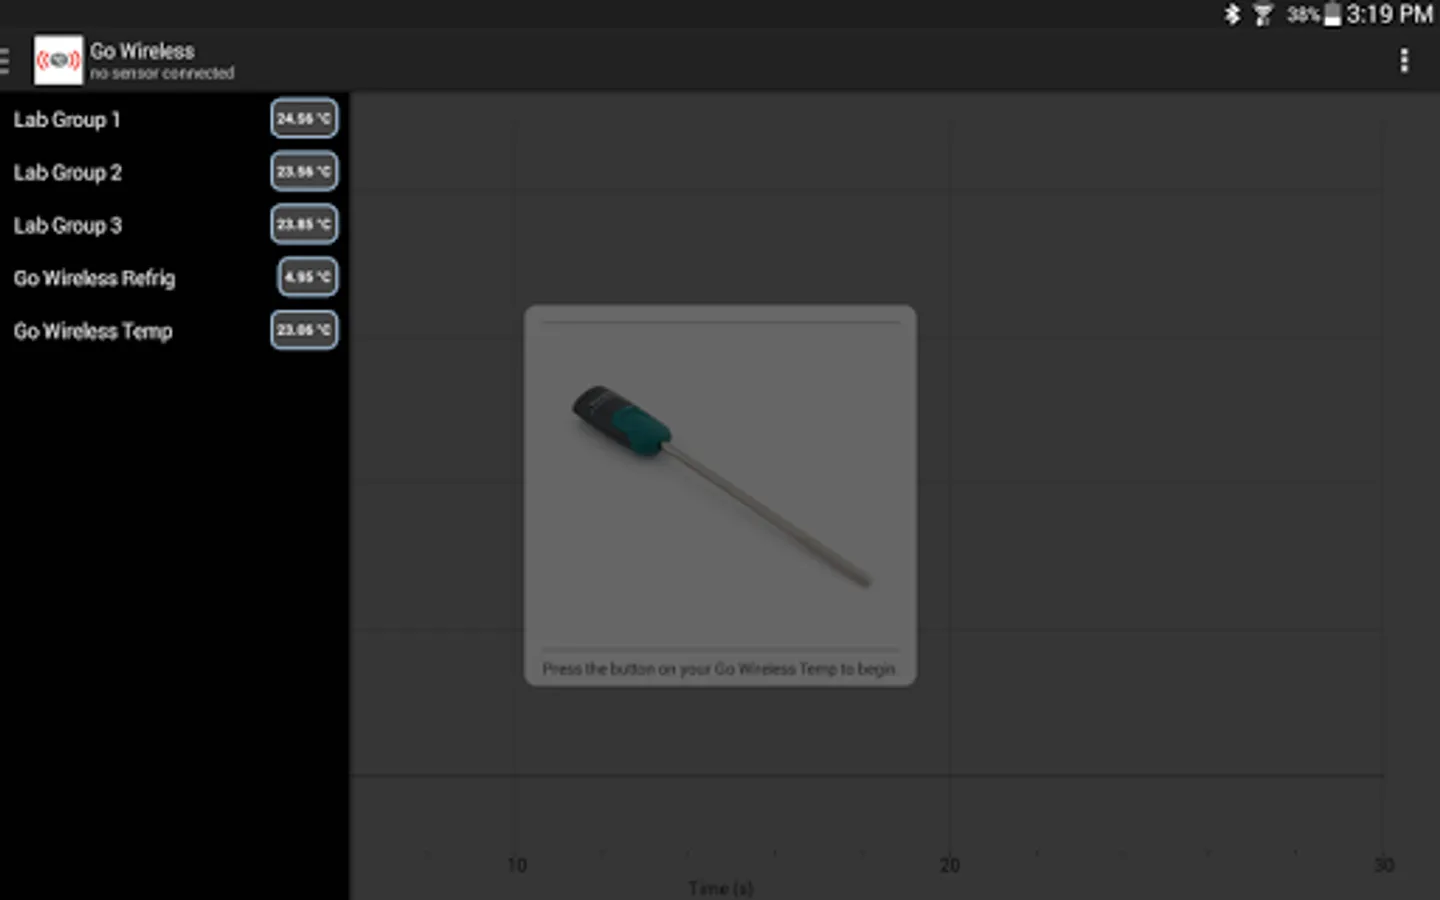
From the list of available sensors
• Discover nearby Go Wireless Temp probes and monitor their temperature readings
• Connect to a specific sensor for further study
When connected to a specific sensor
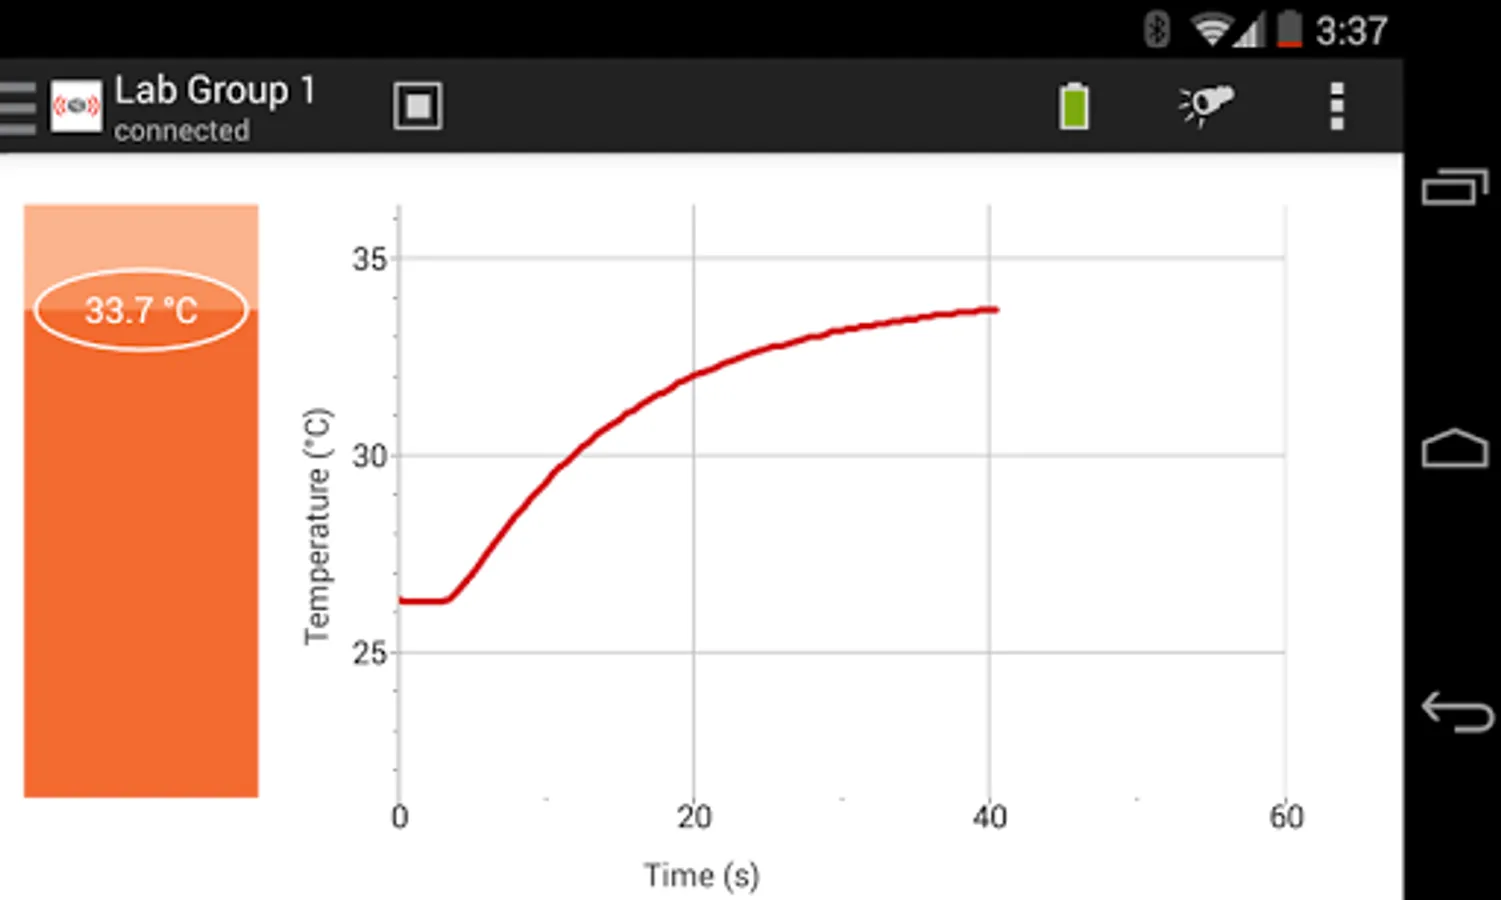
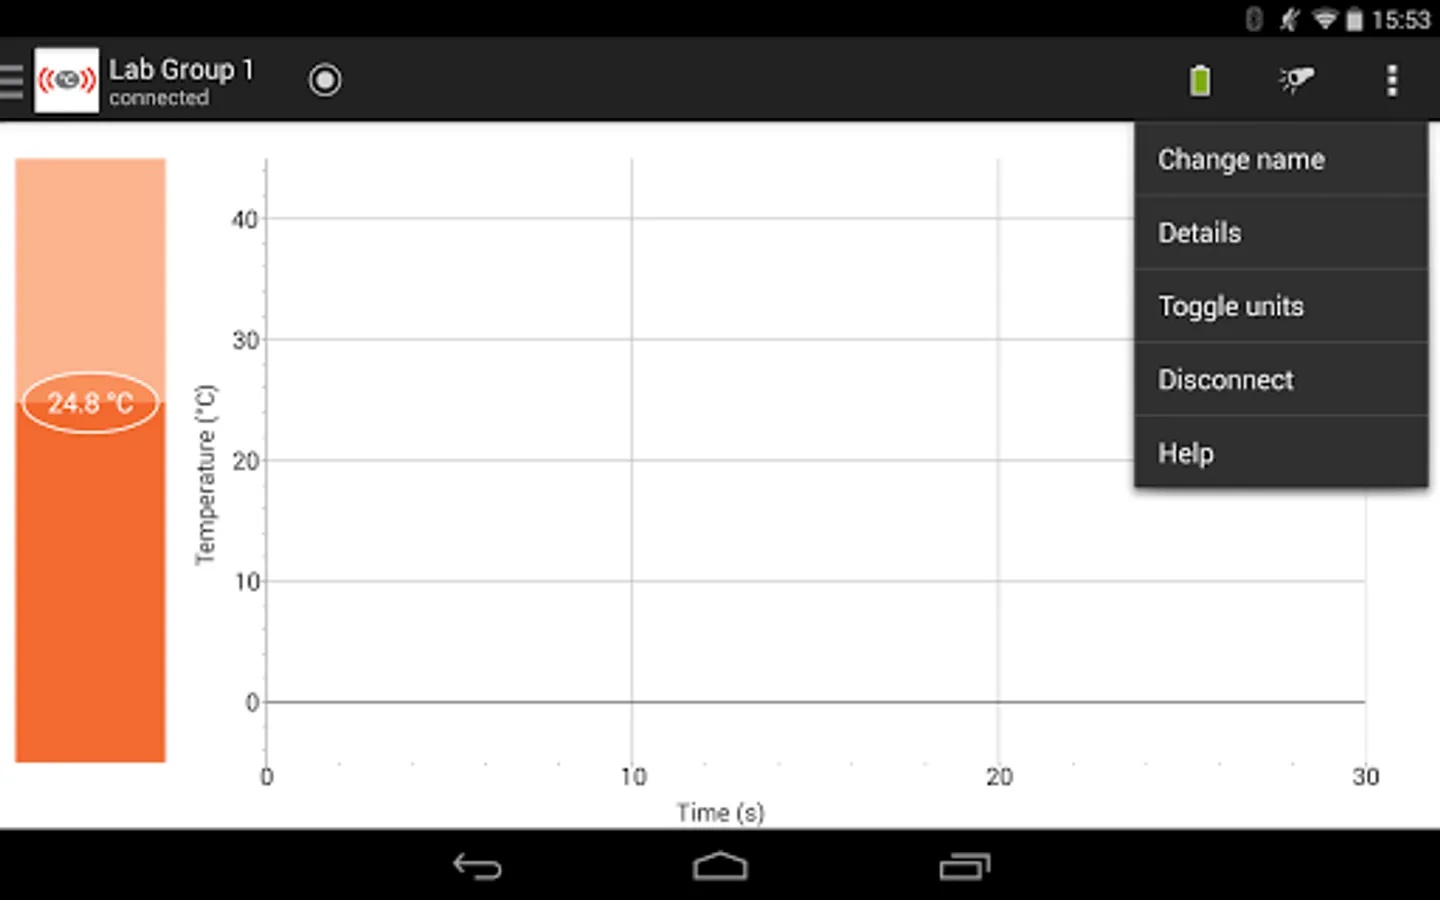
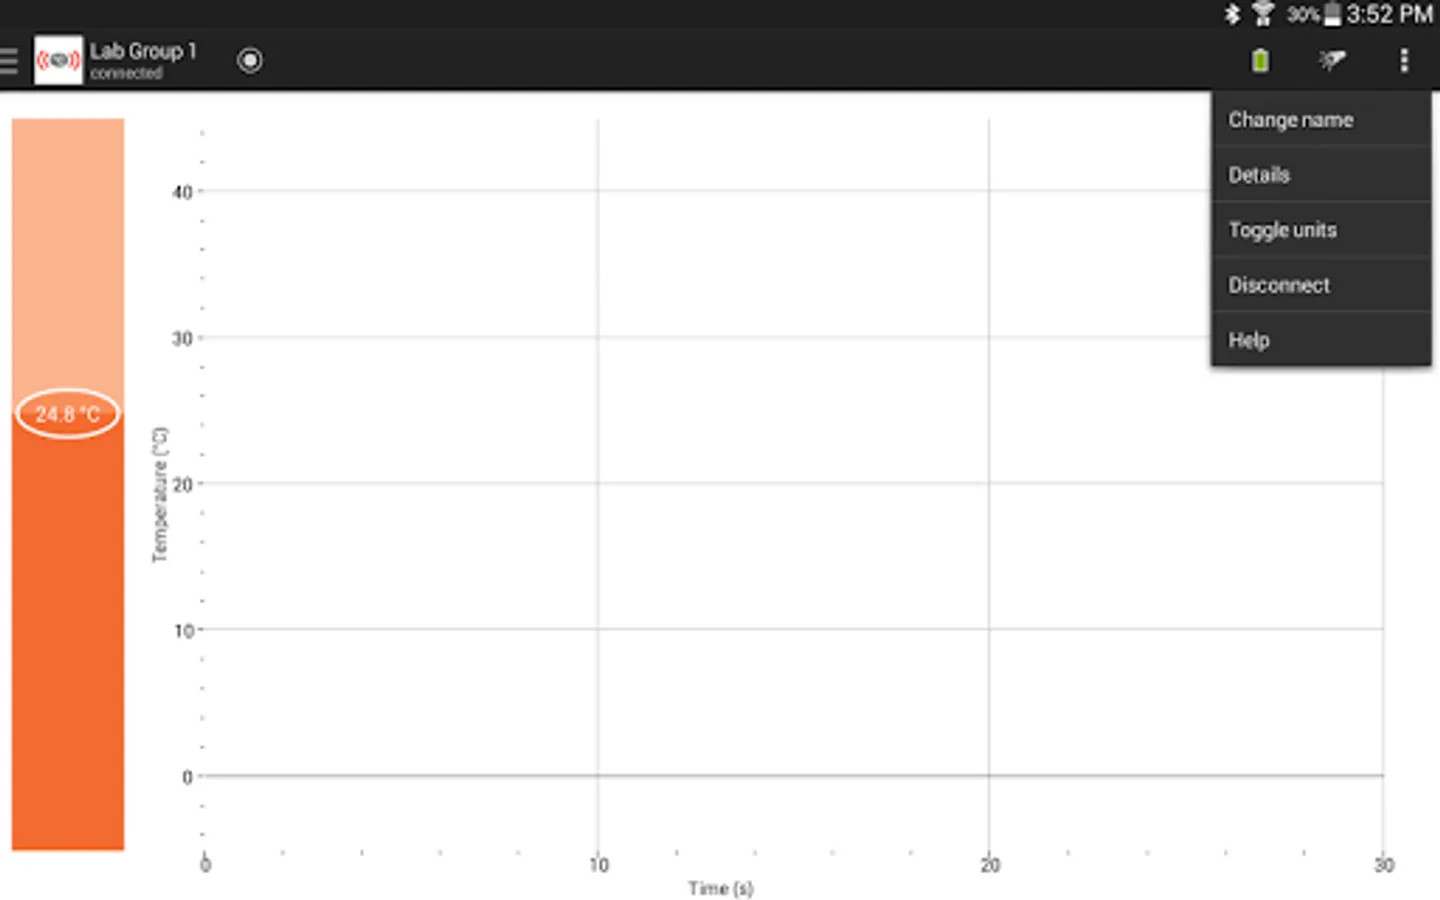
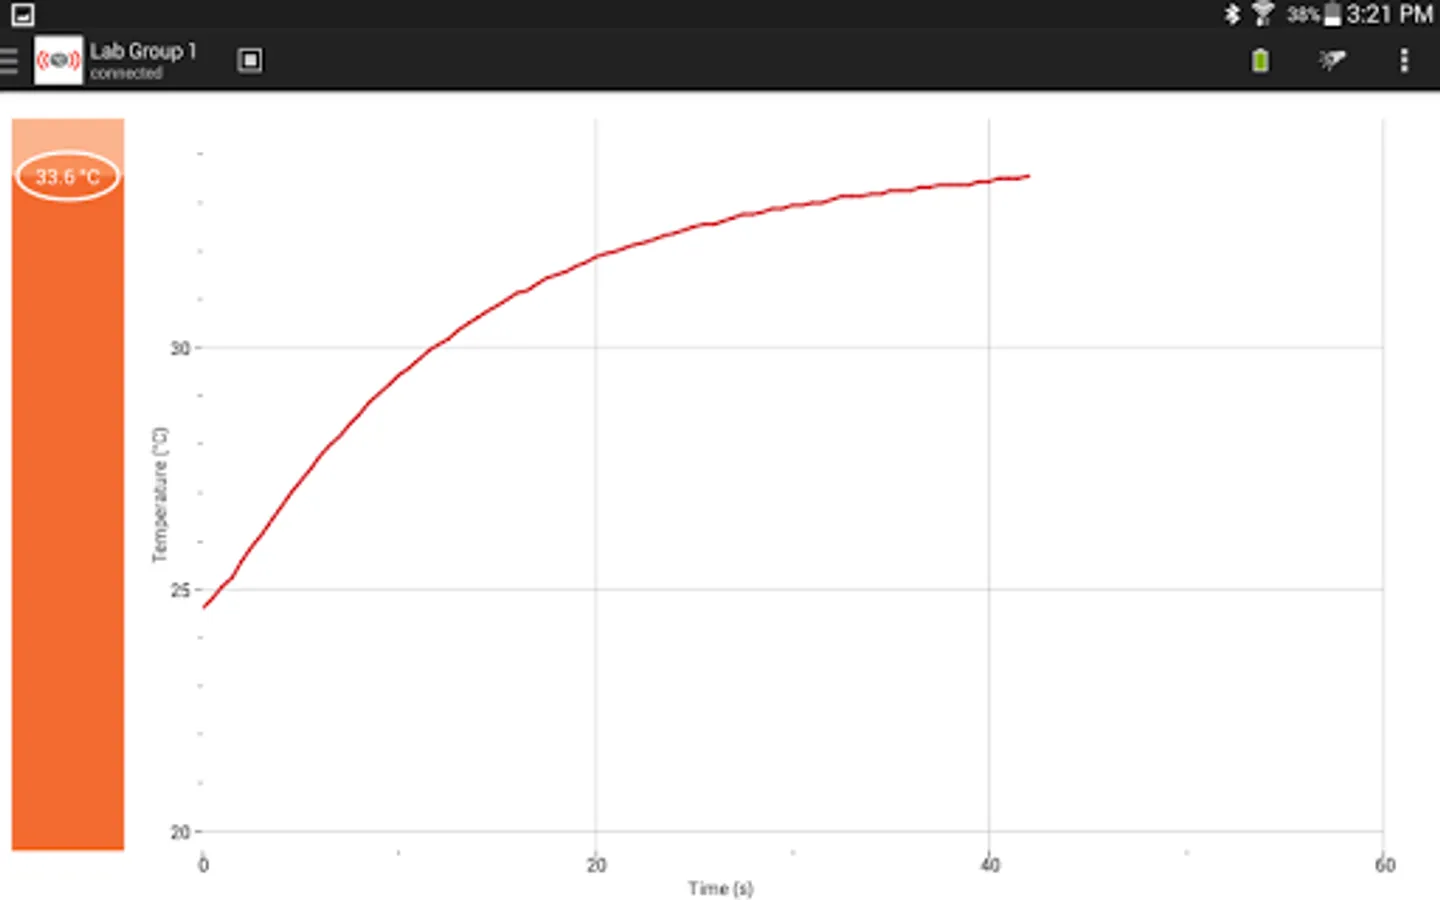
• View live temperature values displayed in a thermometer bar
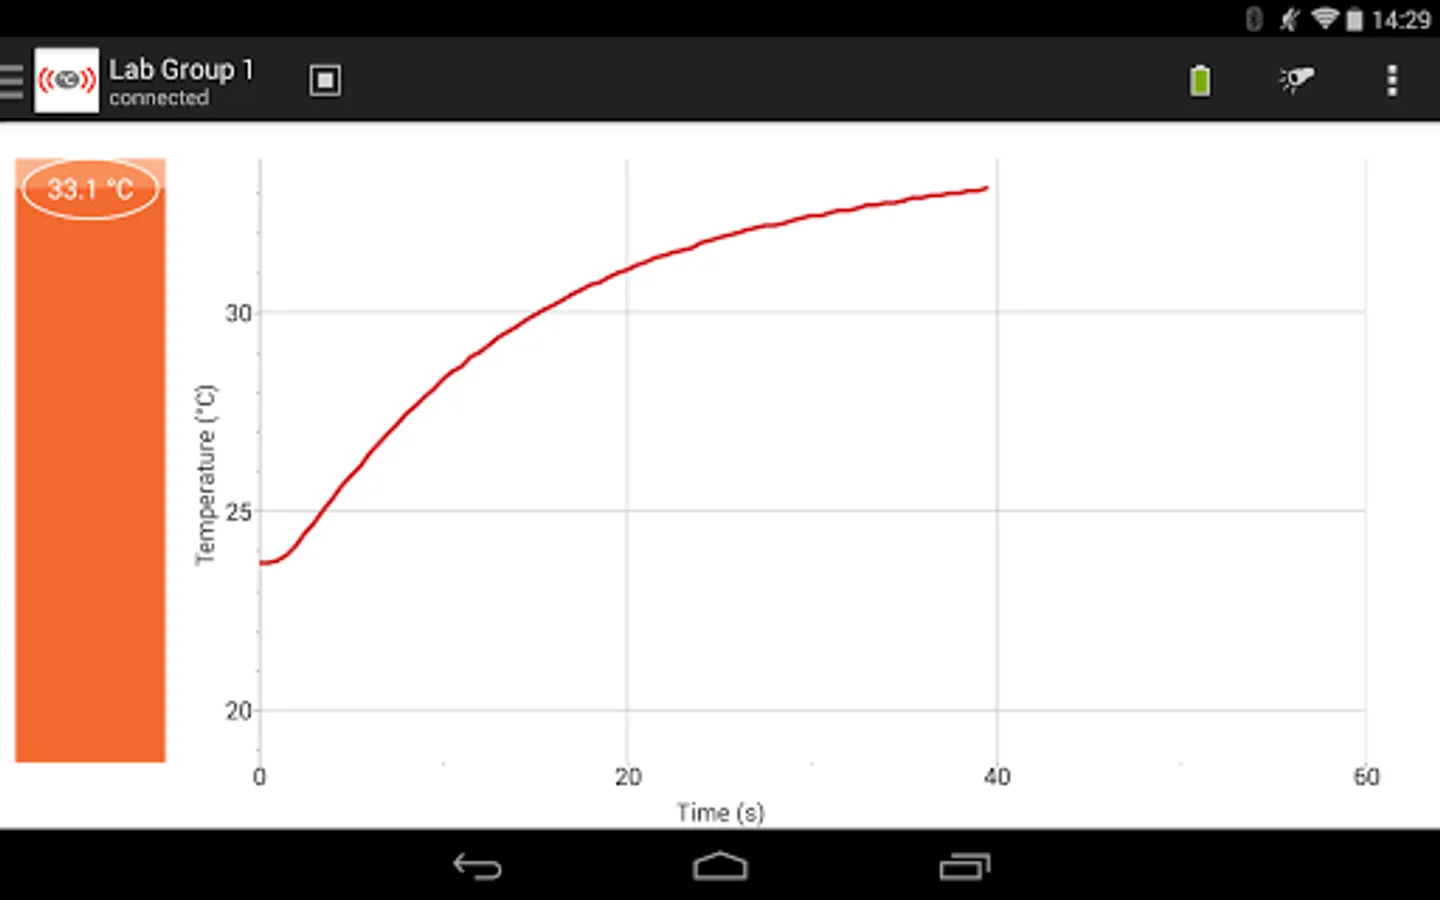
• Collect data – displayed in a graph
• Graph scales automatically to show all collected data
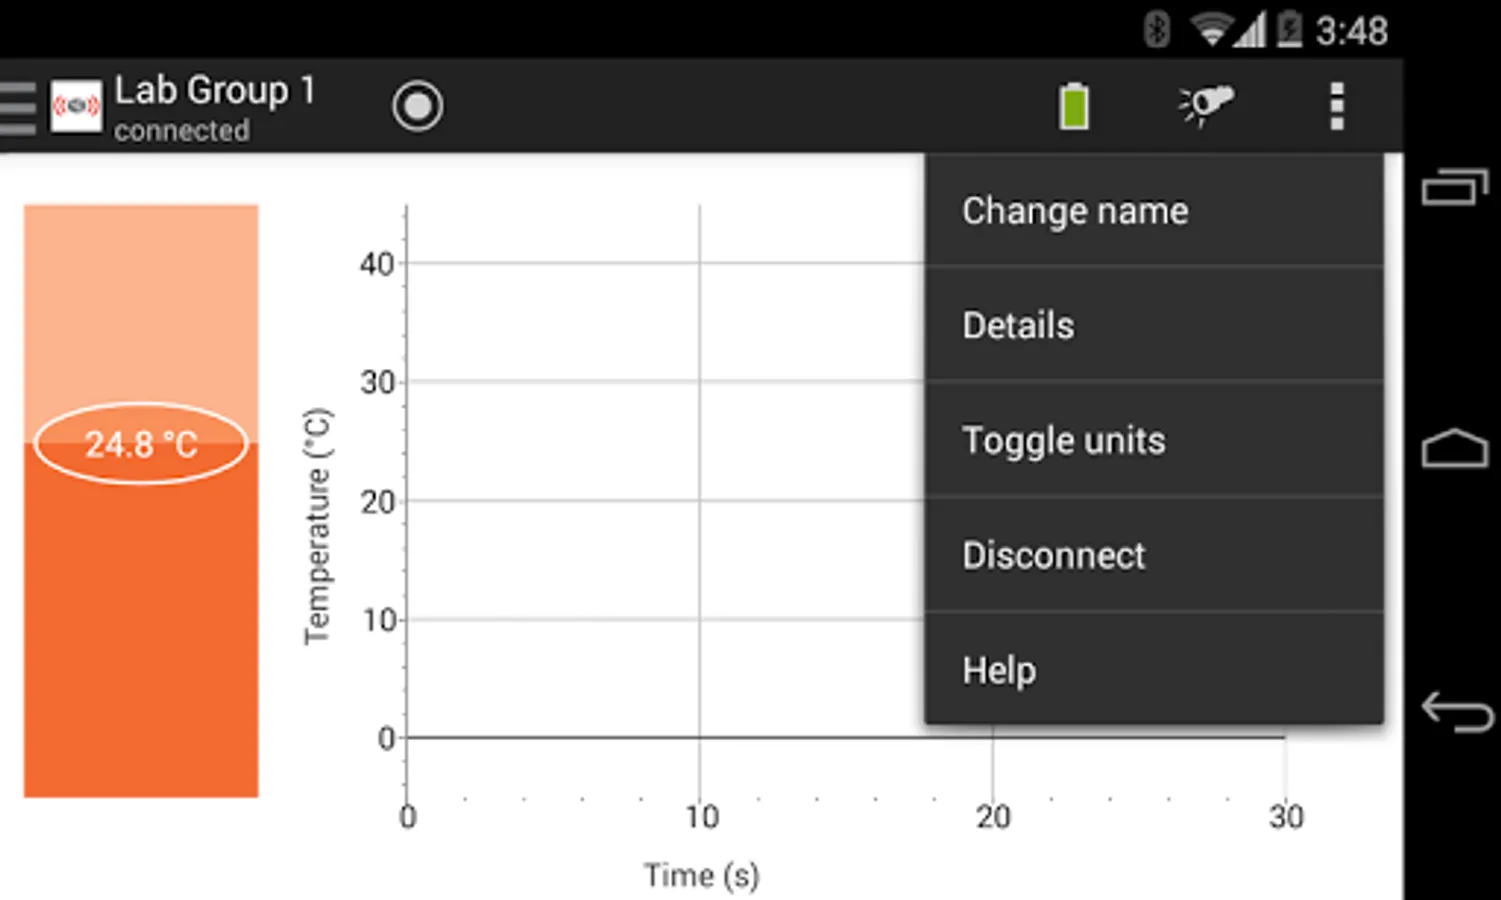
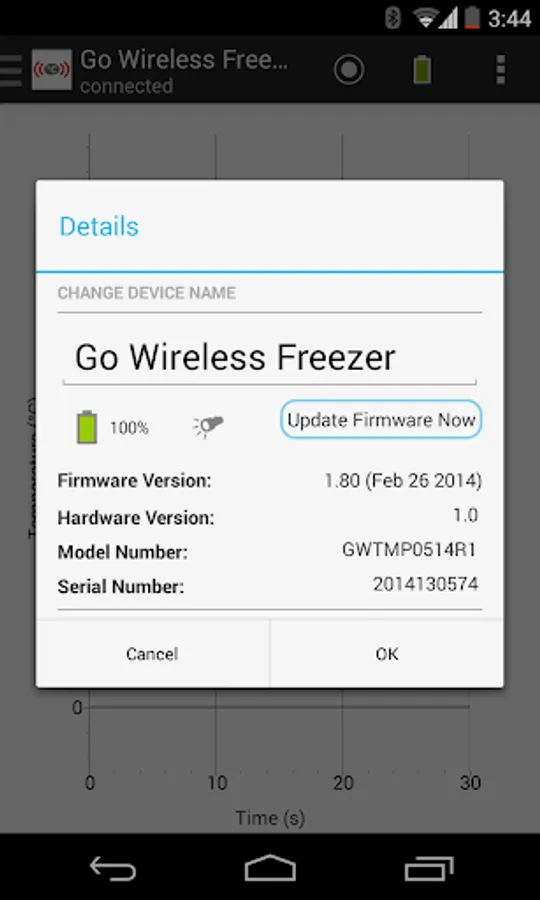
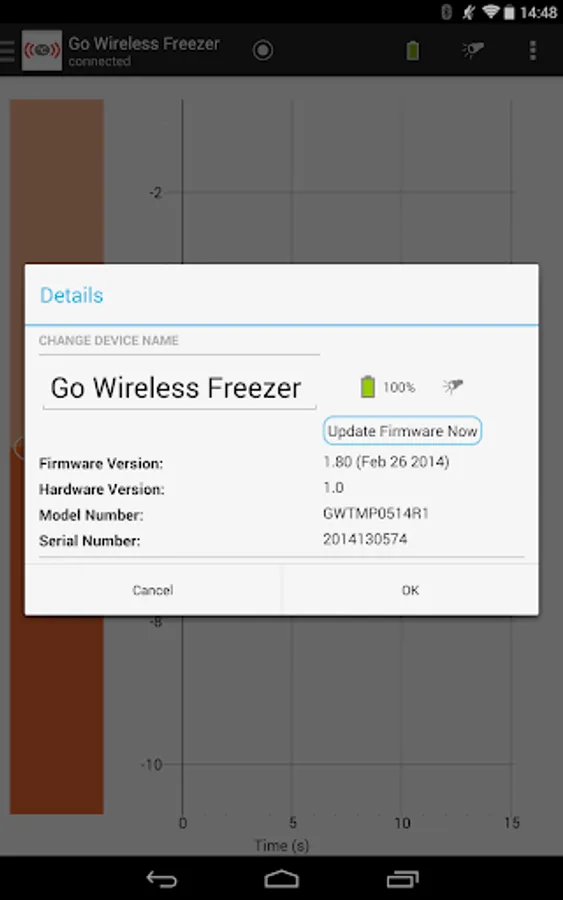
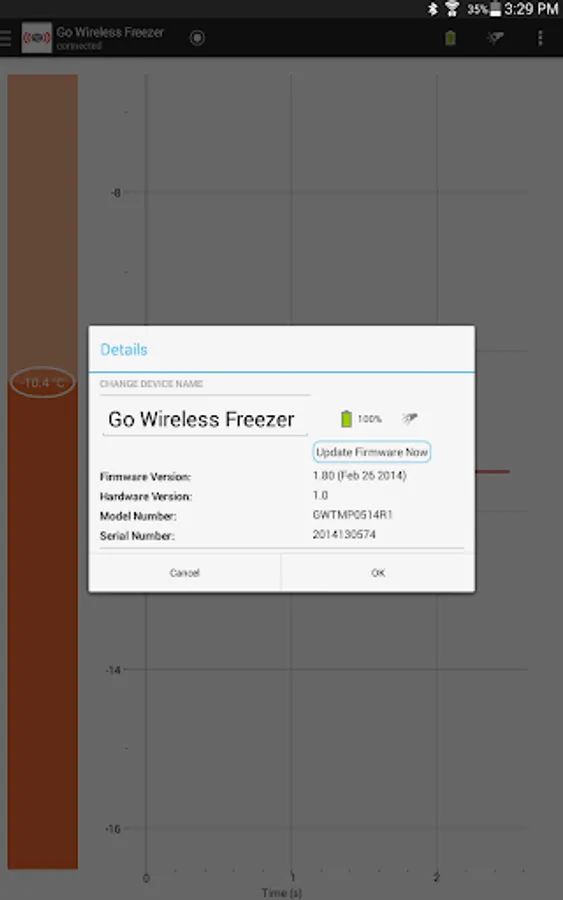
• Customize the sensor name, view battery status, and flash the sensor LED (identify)
• Toggle units
• °C and °F (US – English only)
• °C and K (all other languages)
With collected data
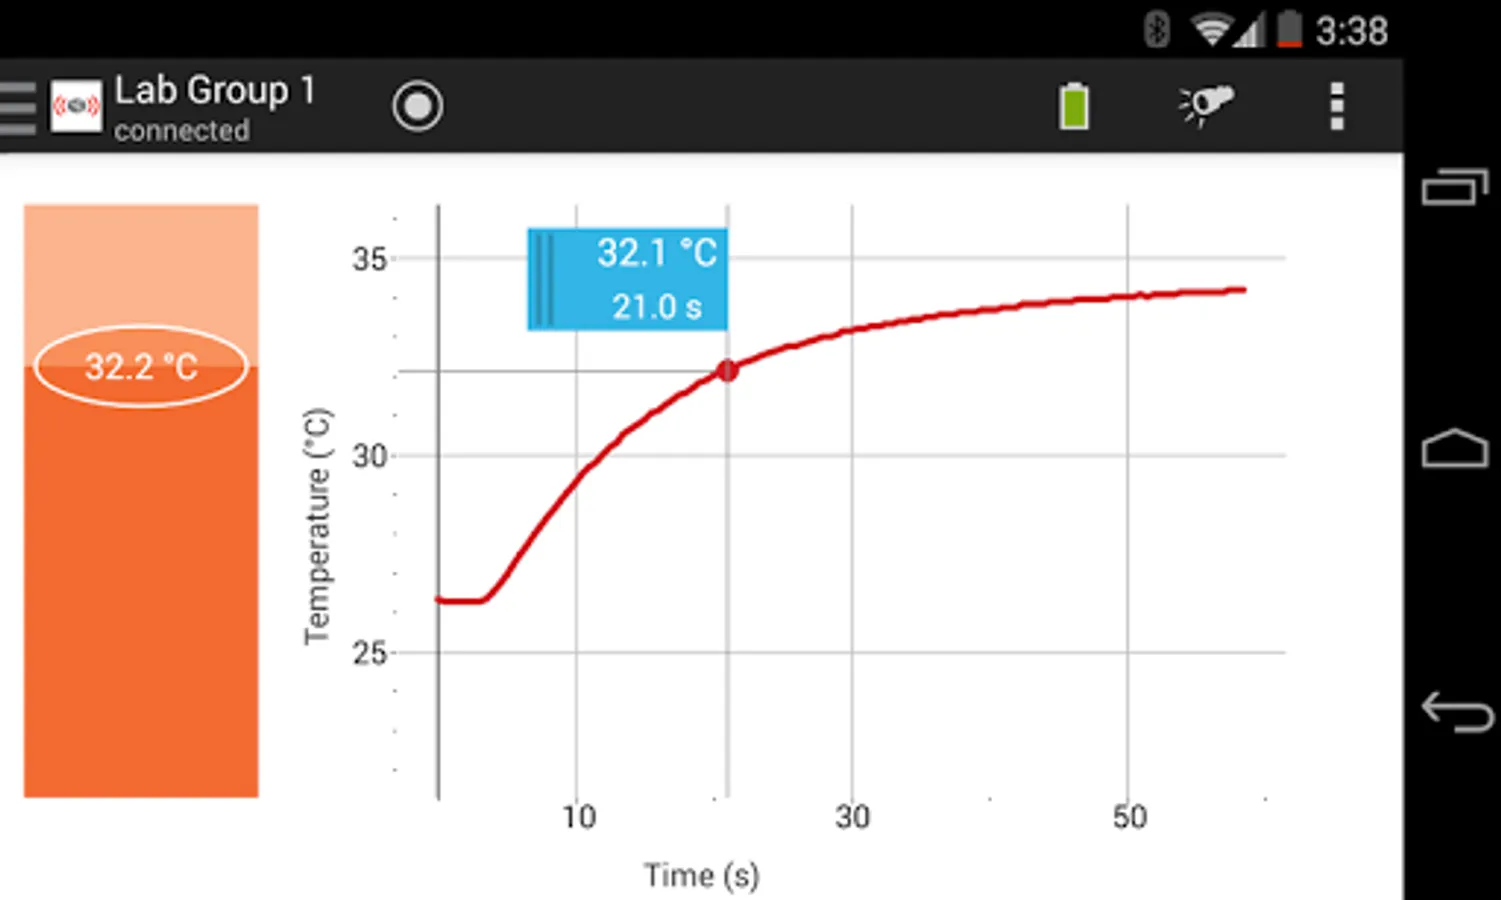
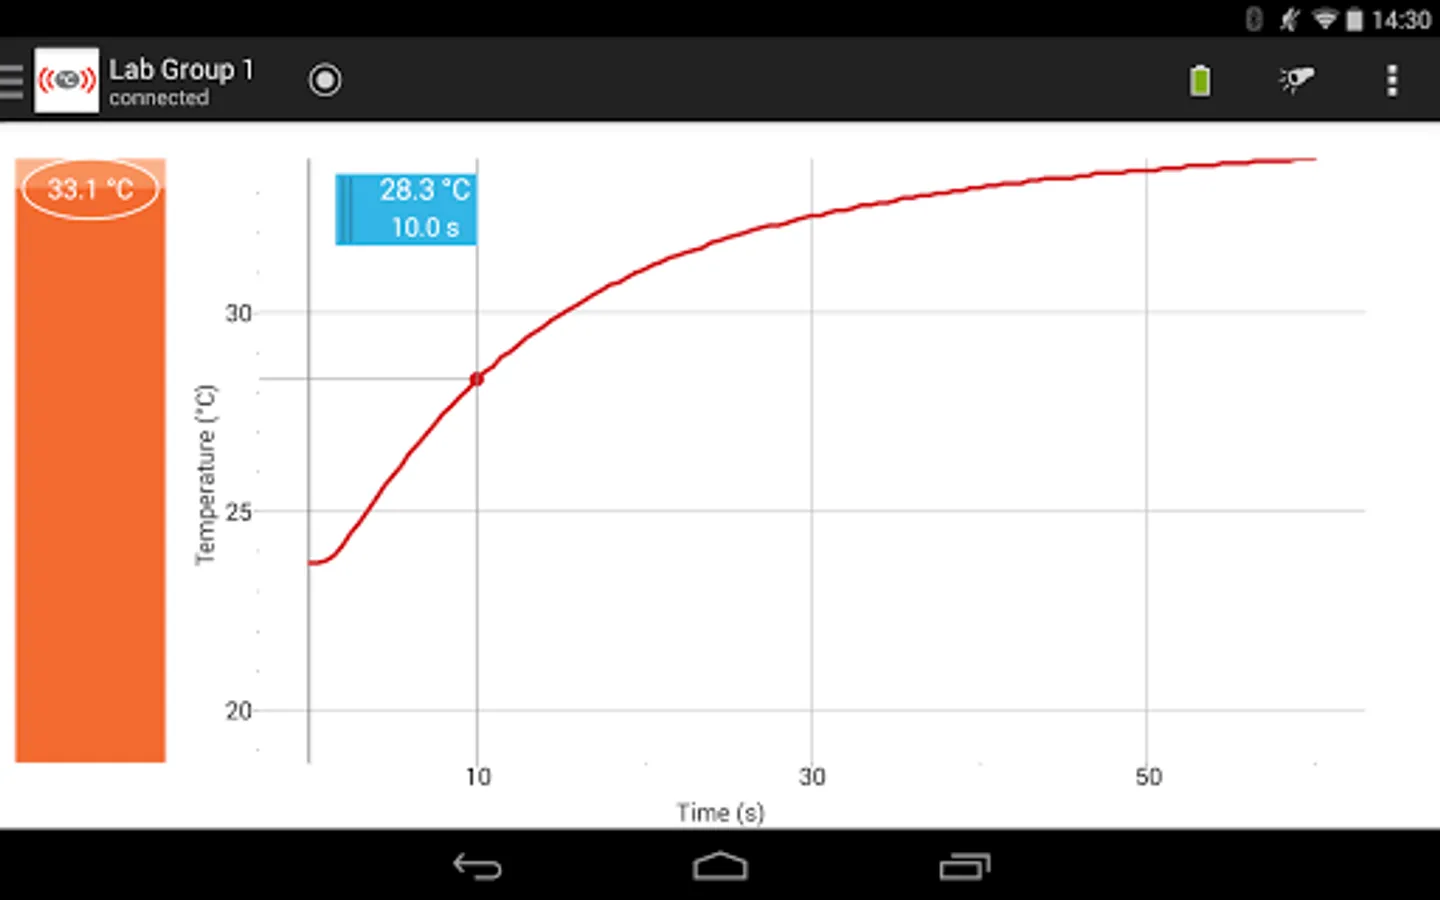
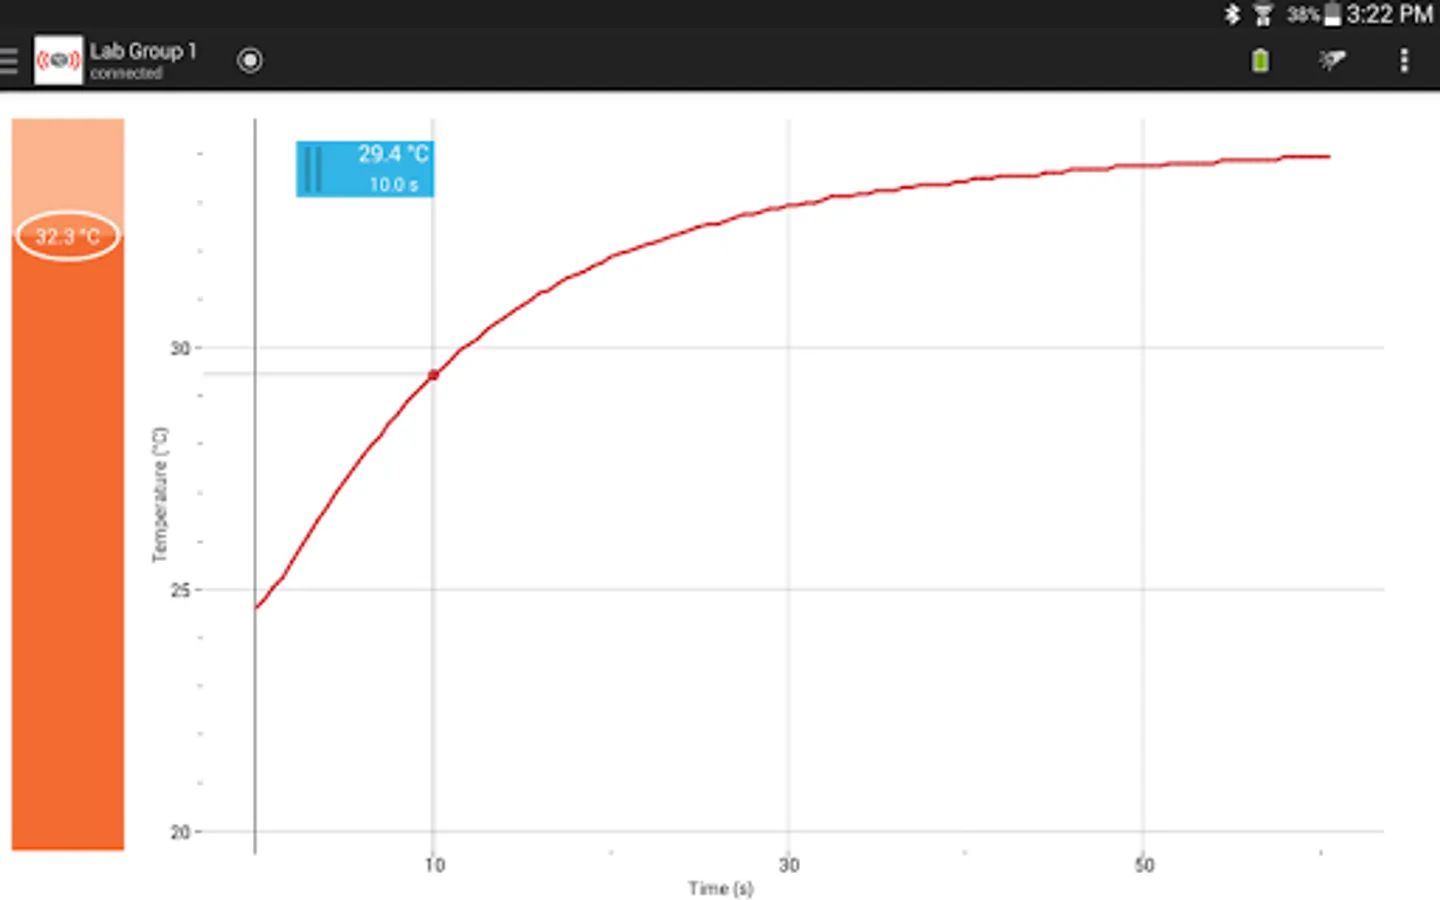
• On the graph - Pinch to zoom /double tap to autoscale
• Tap to examine the collected data
• Select a region to calculate the average temperature
• Tap the statistics box to view additional statistics
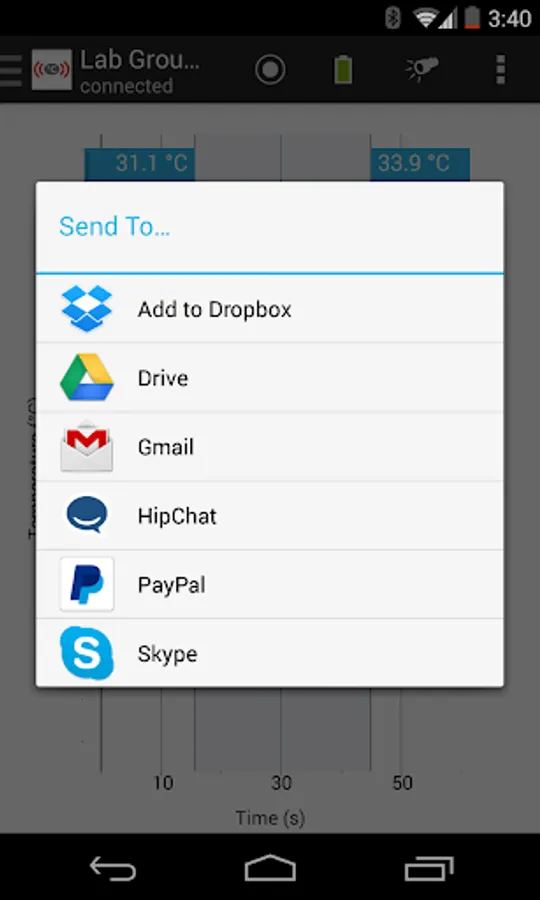
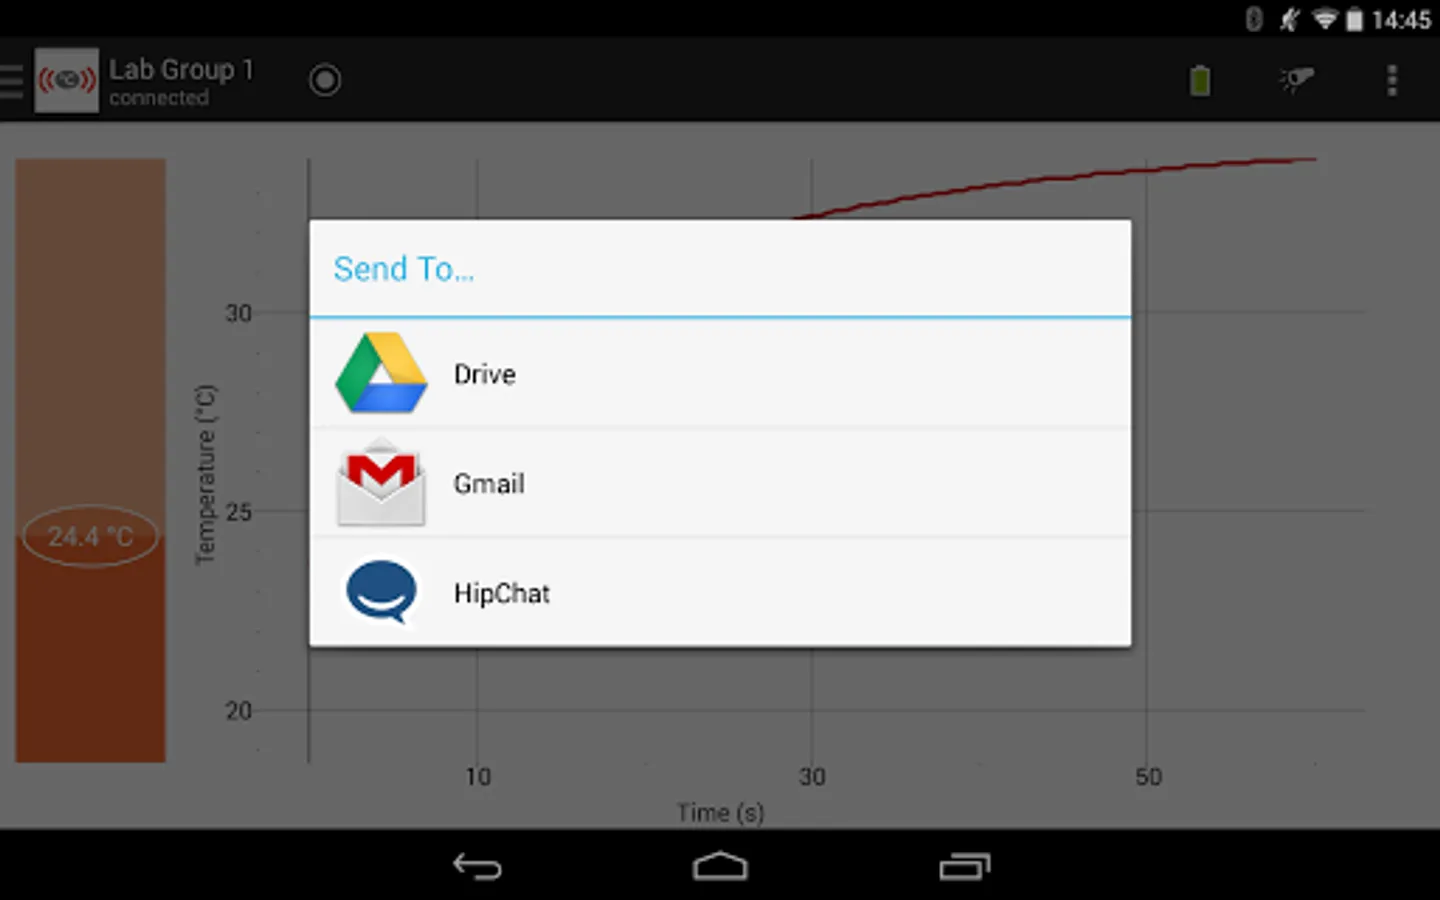
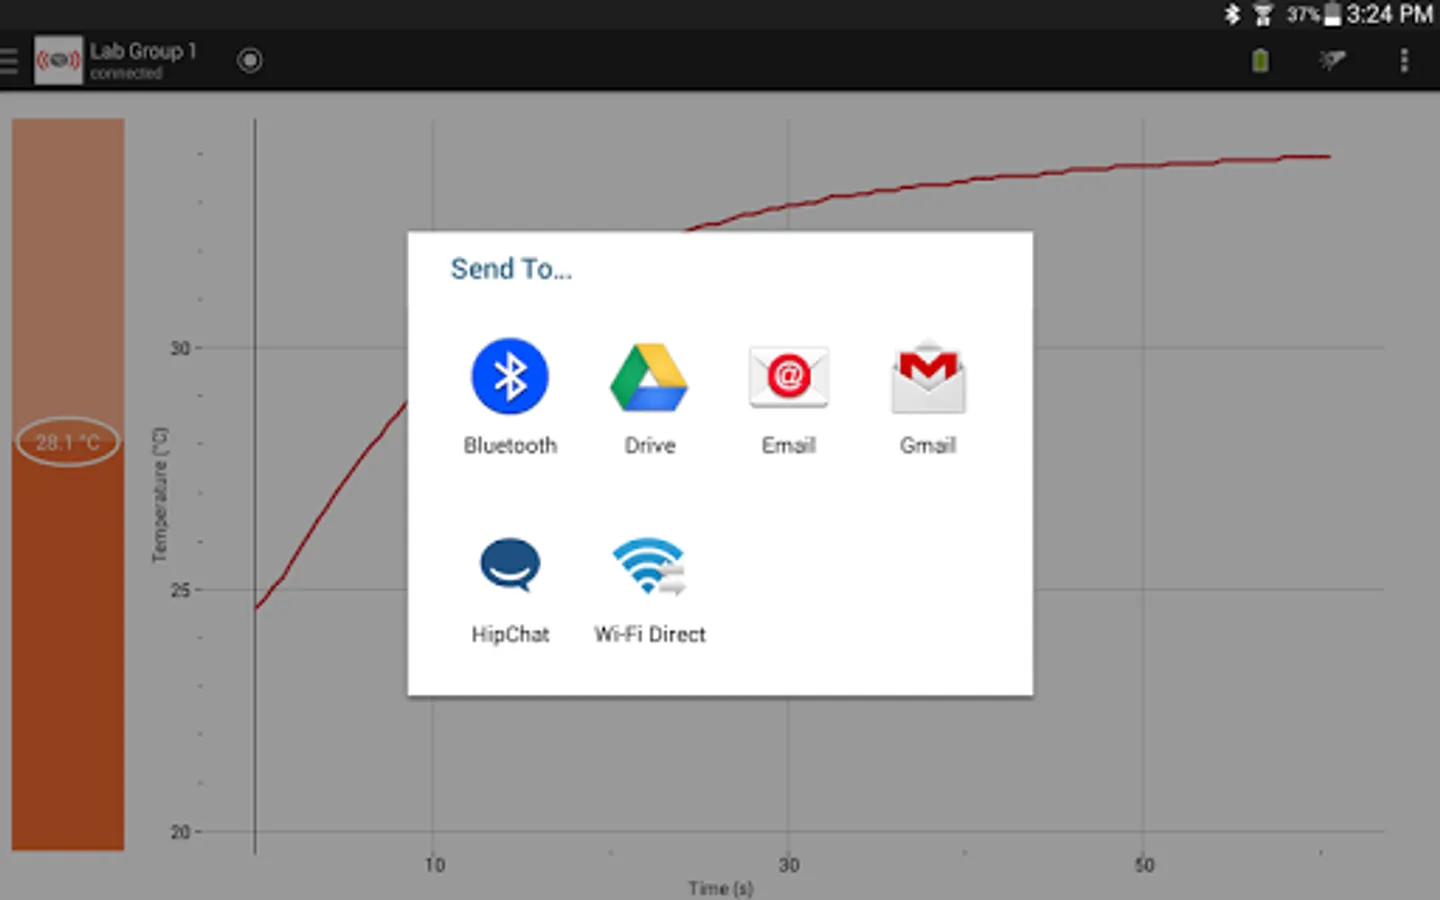
• Export a CSV file for additional analysis in other software
Experiment possibilities include
• Science fair projects
• Monitoring environmental conditions
• Monitoring temperatures in a fish tank or greenhouse
• Measuring the rate of temperature change of a liquid in a Thermos™
• Measuring the temperature of the air coming from an air conditioner or furnace
Vernier Software & Technology has over 30 years of experience in providing effective learning resources for understanding experimental data in science and math classrooms. Go Wireless is a part of Vernier’s extensive system of sensors, interfaces, and data-collection software for science education.
