You can easily create a statistical map for each city, county, and gu unit of the Republic of Korea.
It makes a Choropleth Map that can effectively express statistical values for each administrative district with just 4 touches, and allows you to download it as a PDF file.
* main function
- Visualization of the basic background map of vworld provided by the Ministry of Land, Infrastructure and Transport
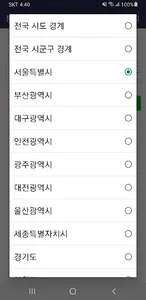
- Provision of national provincial and city administrative boundary maps for statistical purposes
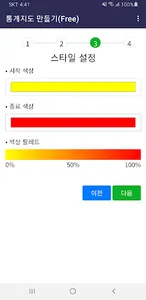
- Direct modification of step classification statistics, download/upload function as CSV file
- Color setting function according to stage classification statistics
- Ability to check the generated statistical map and download it as an A4 size PDF file
* Main data sources
- Base map: open platform (V world, www.vworld.kr)
- Map visualization: Maplibre (www.maplibre.org)
It makes a Choropleth Map that can effectively express statistical values for each administrative district with just 4 touches, and allows you to download it as a PDF file.
* main function
- Visualization of the basic background map of vworld provided by the Ministry of Land, Infrastructure and Transport
- Provision of national provincial and city administrative boundary maps for statistical purposes
- Direct modification of step classification statistics, download/upload function as CSV file
- Color setting function according to stage classification statistics
- Ability to check the generated statistical map and download it as an A4 size PDF file
* Main data sources
- Base map: open platform (V world, www.vworld.kr)
- Map visualization: Maplibre (www.maplibre.org)
Show More