AppRecs review analysis
AppRecs rating . Trustworthiness 55 out of 100. Review manipulation risk 20 out of 100. Based on a review sample analyzed.
★
AppRecs Rating
Ratings breakdown
5 star
0%
4 star
0%
3 star
0%
2 star
100%
1 star
0%
What to know
⚠
Mixed user feedback
Average 2.0★ rating suggests room for improvement
About myVectron
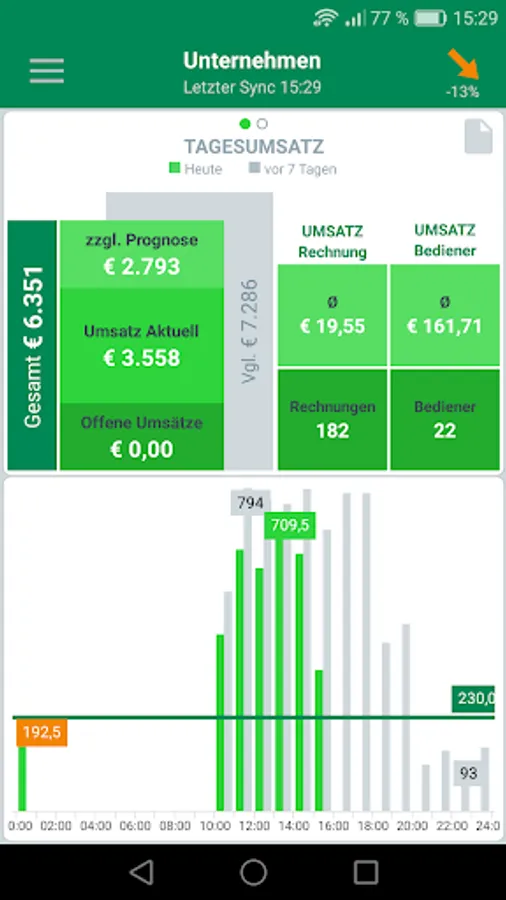
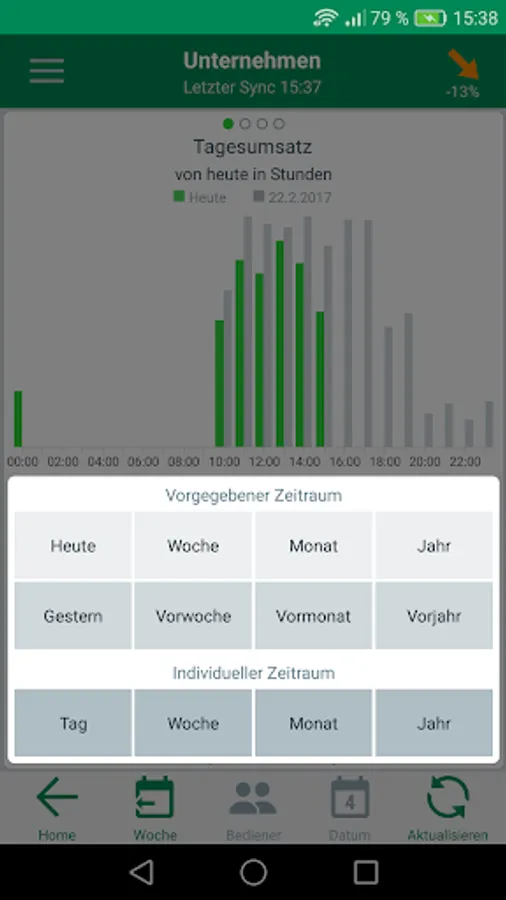
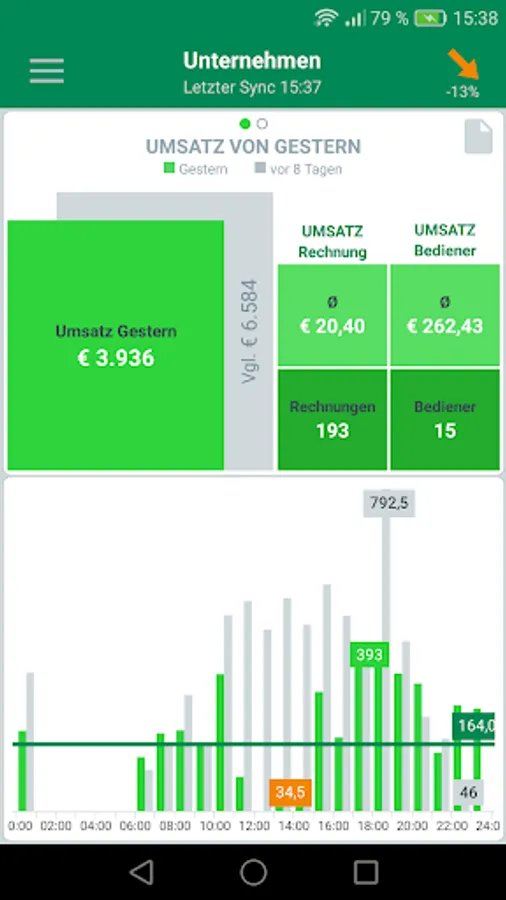
Analysis and reporting tools with clearly arranged dashboards facilitate the controlling. With the myVectron-App you get access to the most important key figures of your company from anywhere, no matter whether you run one or dozens of branches. You always have the overview on current sales, customers, invoices, the number of operators and when the respective sales were generated, each with the reference value. Furthermore, a detailed chart is available for any of these values.
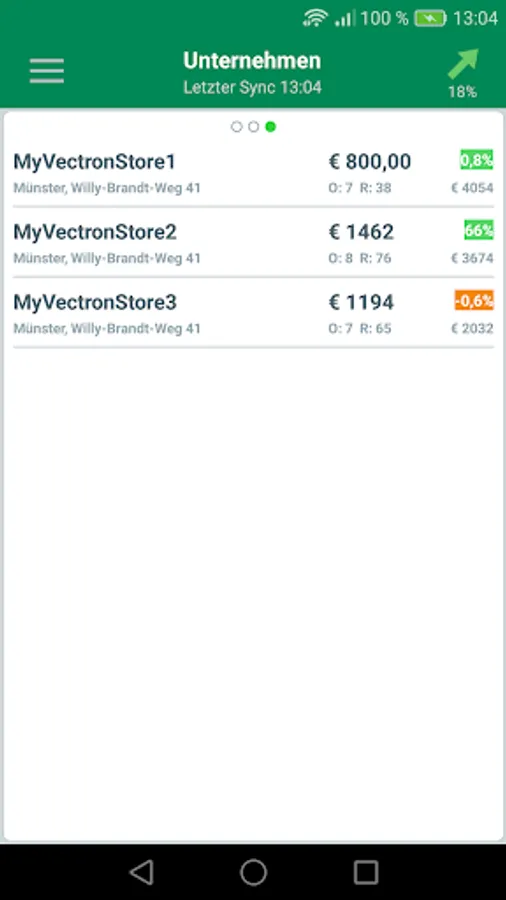
The MyVectron-App provides forecasts for your company or for every single branch; it builds trends and shows you the expected sales by the branch. For trends and forecasts your daily sales are always calculated in relation to the day of the previous week to make the forecast as realistic as possible. The list of branches displays sales, trends and forecasts as well as the number of invoices/customers and operators at a glance. You can sort this list by sales or by other criteria.
The dashboard can quickly switch between sales of the current and the previous day.
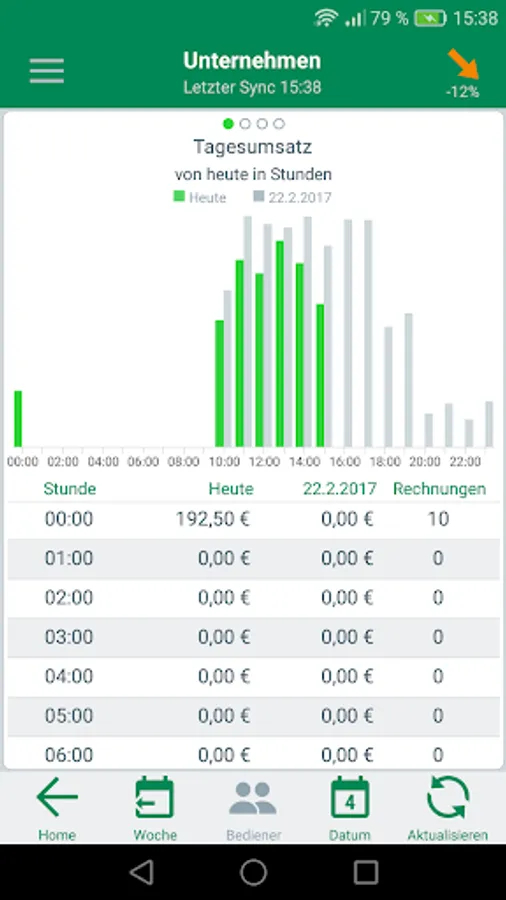
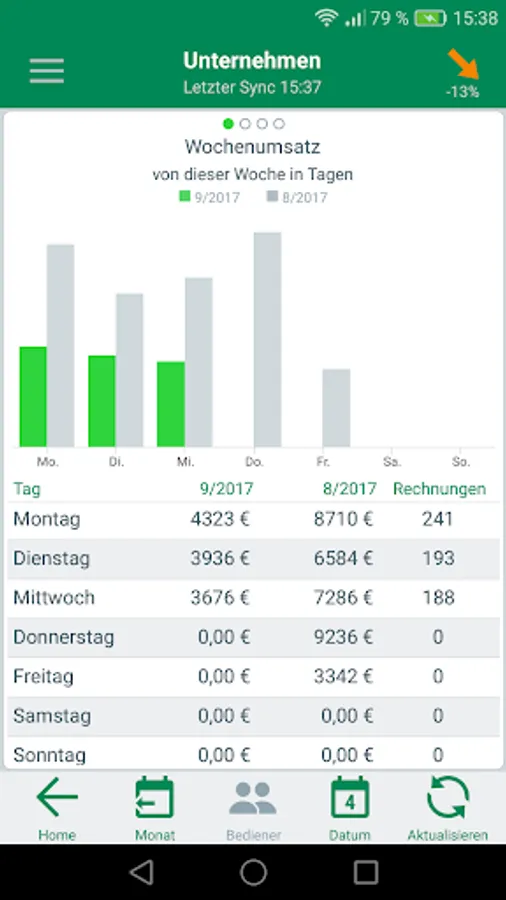
Of course you can display the past sales in common time frames and compare them to respective periods.
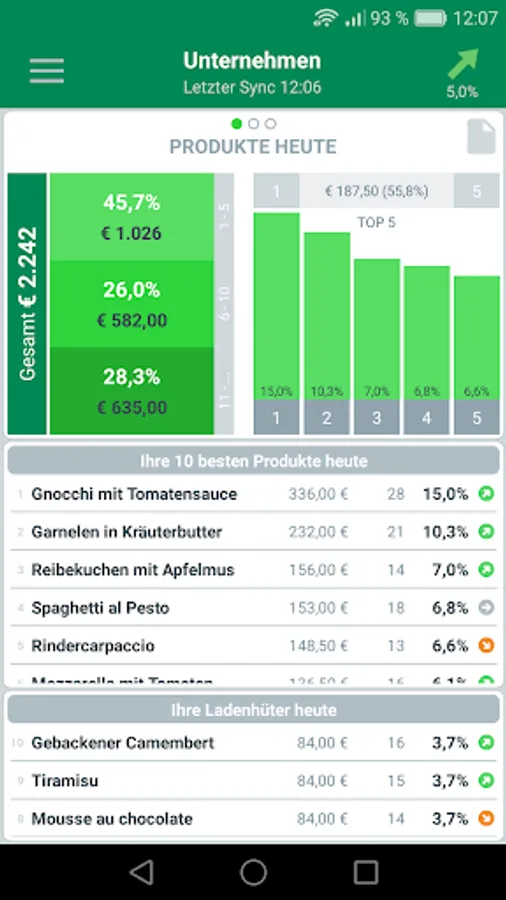
The myVectron-App displays your bestsellers as well as your slow sellers at a glance. Not only does it show the single titles but also the ratio of your top 5, top 10 and other products to the total sales, as percentage and as amount .
The easy operation of the myVectron-App is our top priority.
You can check all the data combined for your company but also individually for each branch.
- Daily sales
- Number of previous invoices / customers
- Number of operators
- Sales forecasts and trends
- Changes and comparison to previous week or other reference periods
- Average sales per invoice or operator
- Maximum, minimum, average sales per hour
- Selection list of all branches
- Operator ranking in the branches
- Product sales
- open sales for Company and branch
- individual Watchlist for products
