About Воздух Азия
The aqca.asia mobile application was developed by the NGO MoveGreen to inform Central Asians about air quality in real time.
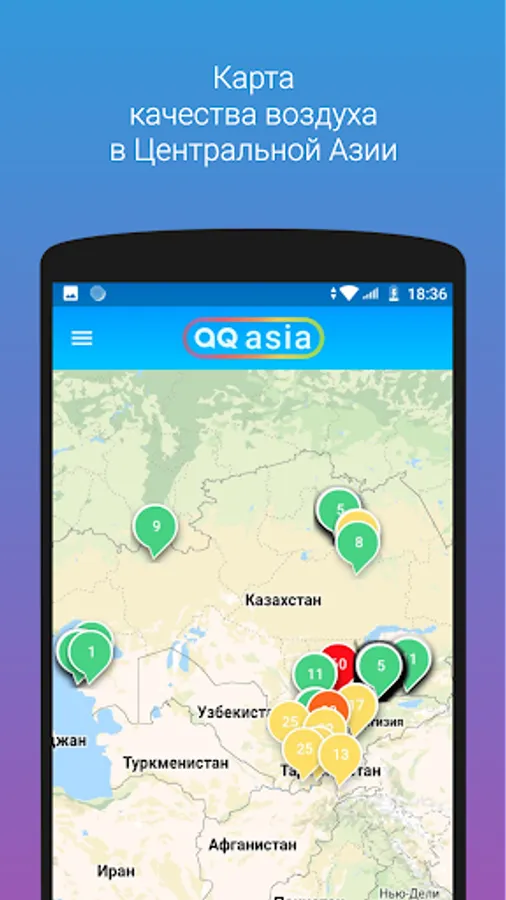
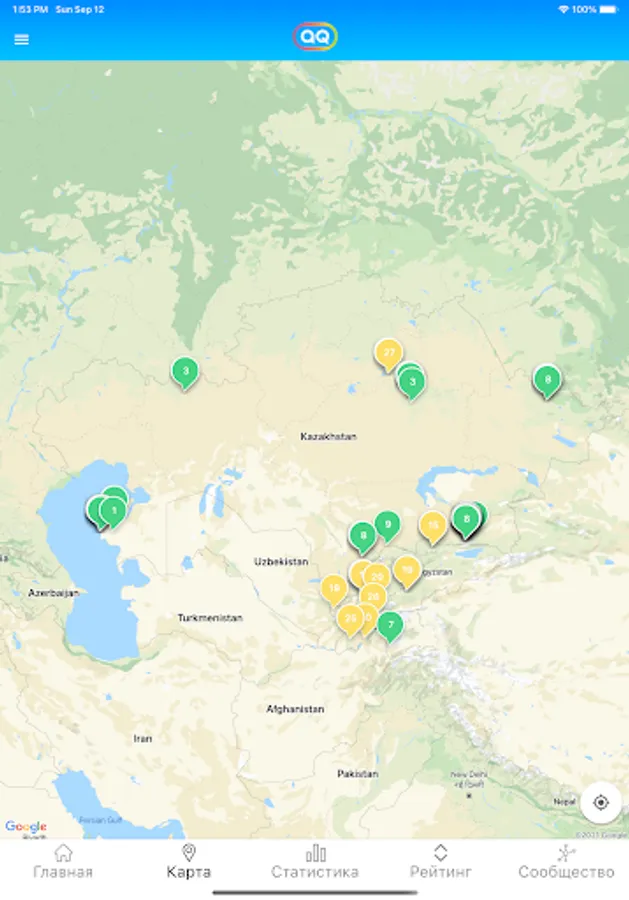
The application accumulates data from various air quality monitoring sensors installed in the region.
Users can select the desired location to obtain information about the air quality at this point or use geolocation (in this case, air quality data will be displayed from the location closest to you).
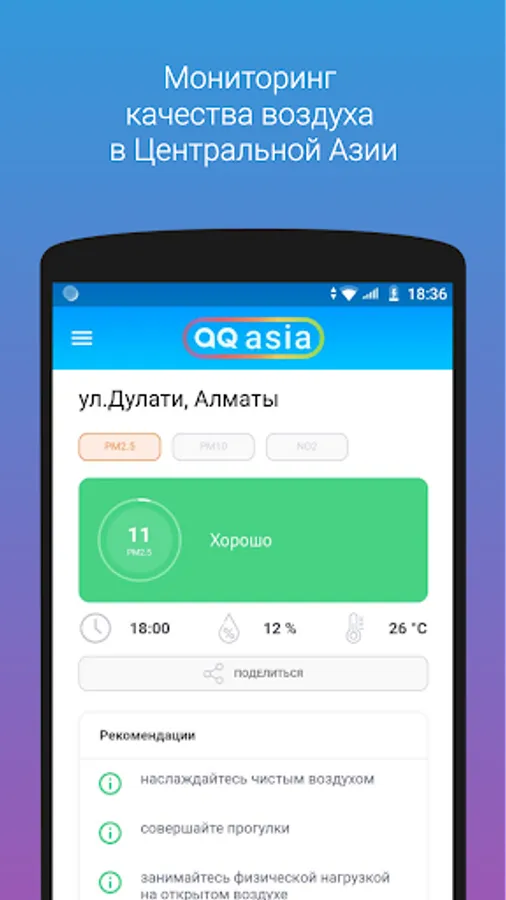
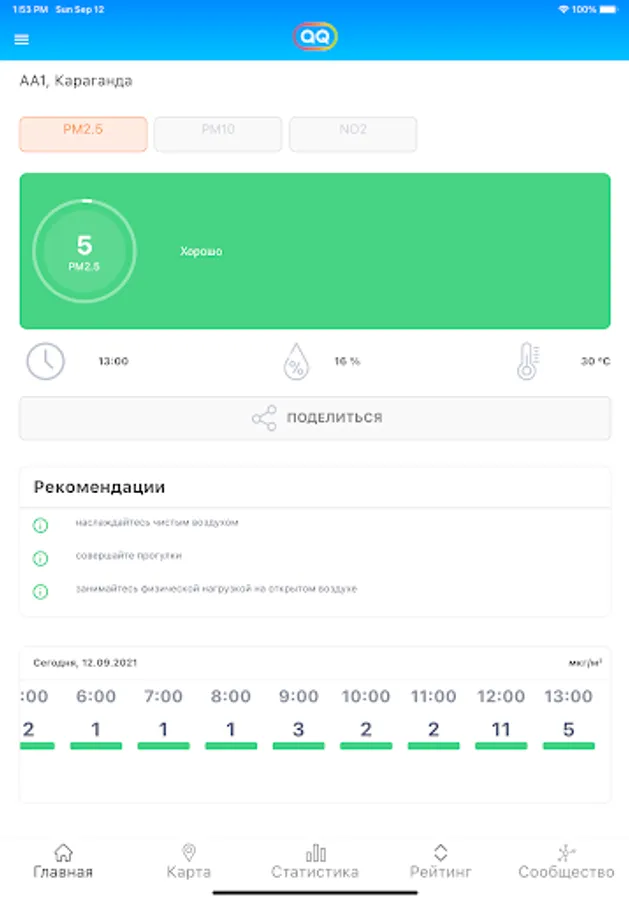
The application displays the main indicators of the concentration of pollutants in the air of the selected post (depending on the configuration):
- nitrogen dioxide (NO2);
- suspended particles PM10;
- suspended particles PM2.5;
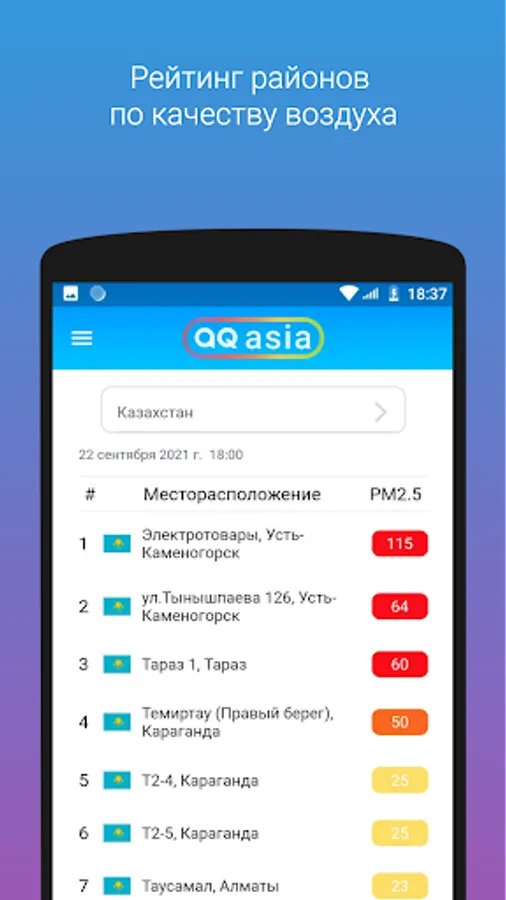
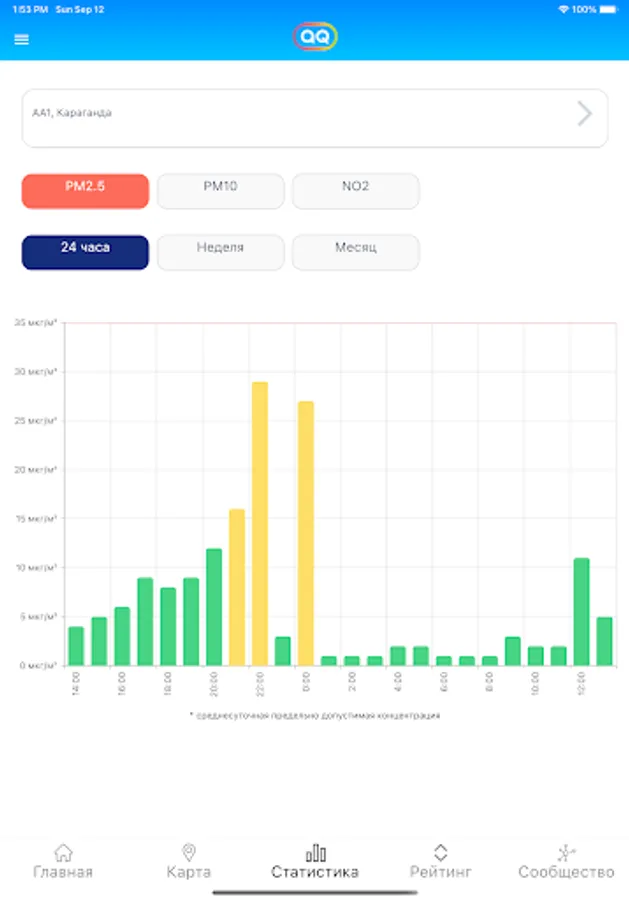
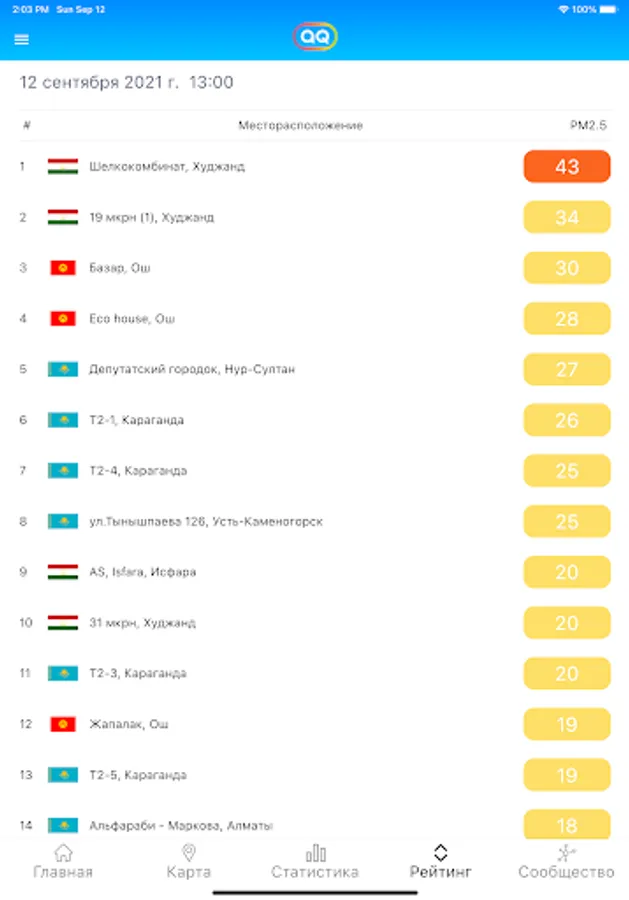
For each substance it is possible to view the concentration level in μg / m3 and in relation to the maximum permissible concentration on a color scale based on the AQI (Air Quality Index) scale: green - low pollution level; yellow - increased level; orange - high level; red, purple and burgundy are very high levels.
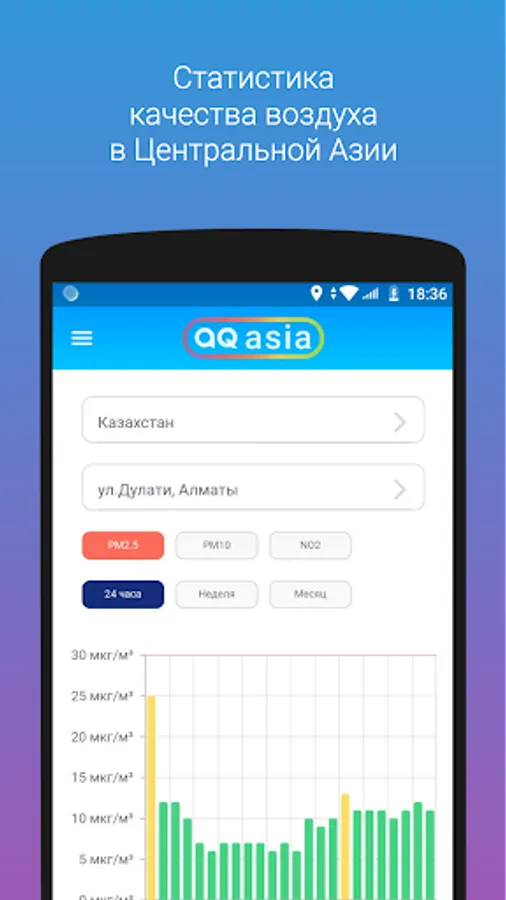
The actual data can be accessed from each sensor separately. In addition to information on the level of pollution by substances, the application also provides data on temperature and humidity. In addition, using the mobile application, you can view statistics for a specific period: day, week and month. The data received from the sensors is updated every 1 to 3 hours.
The application accumulates data from various air quality monitoring sensors installed in the region.
Users can select the desired location to obtain information about the air quality at this point or use geolocation (in this case, air quality data will be displayed from the location closest to you).
The application displays the main indicators of the concentration of pollutants in the air of the selected post (depending on the configuration):
- nitrogen dioxide (NO2);
- suspended particles PM10;
- suspended particles PM2.5;
For each substance it is possible to view the concentration level in μg / m3 and in relation to the maximum permissible concentration on a color scale based on the AQI (Air Quality Index) scale: green - low pollution level; yellow - increased level; orange - high level; red, purple and burgundy are very high levels.
The actual data can be accessed from each sensor separately. In addition to information on the level of pollution by substances, the application also provides data on temperature and humidity. In addition, using the mobile application, you can view statistics for a specific period: day, week and month. The data received from the sensors is updated every 1 to 3 hours.
Воздух Азия Screenshots

Tap to Rate: