About Graph plotter and exploration
Online calculator of function exploration (Study of function) allows you to find
[✔] The domain of the function
[✔] The intersection points with the X-axis coordinate
[✔] The intersection points with the Y-axis coordinate
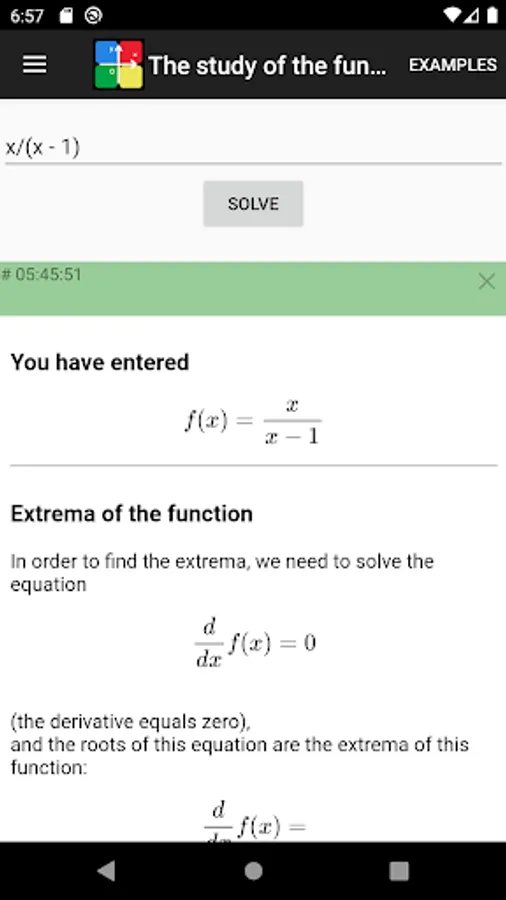
[✔] Function extrema
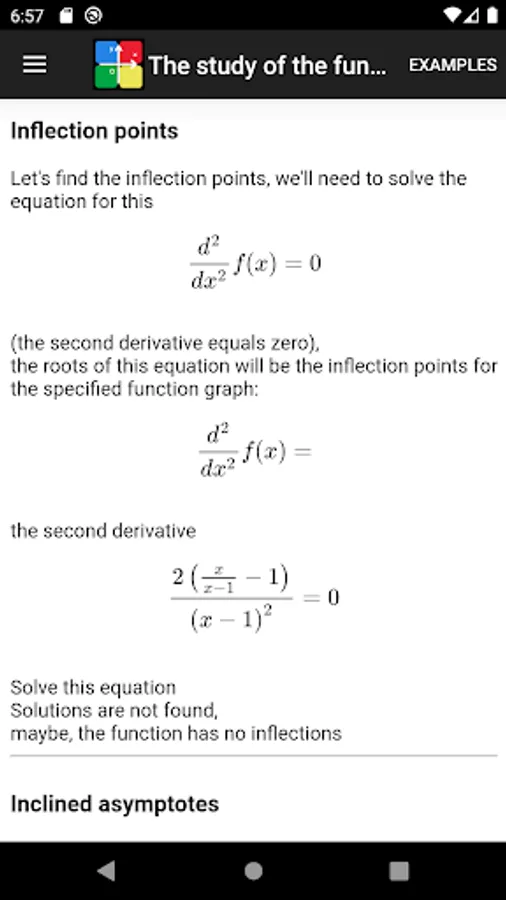
[✔] Function inflection points
[✔] Vertical asymptotes
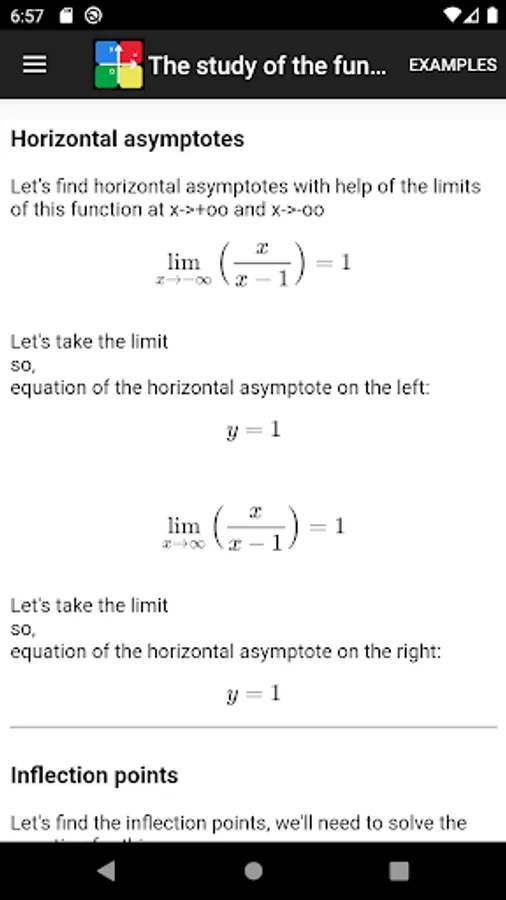
[✔] Horizontal asymptotes
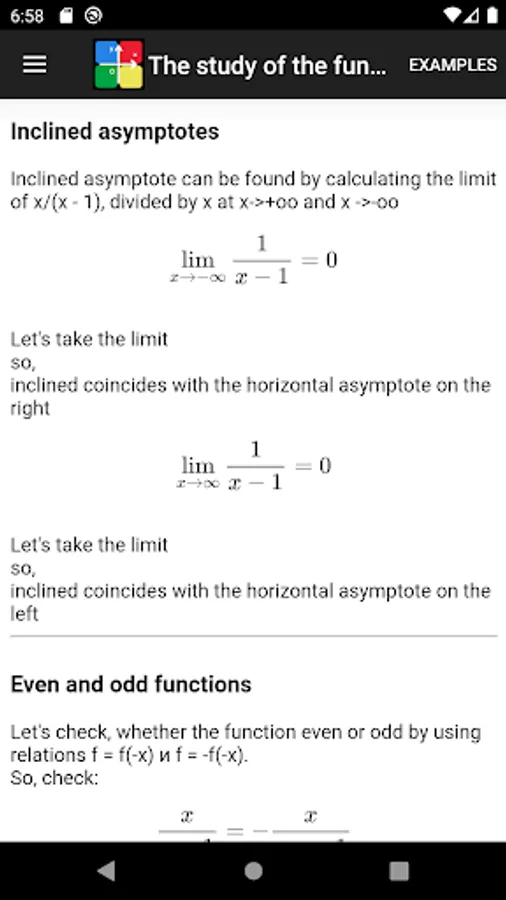
[✔] Inclined asymptotes
[✔] Whether the function even or odd
[✔] Build a graph of a function
The calculator (as a plotter or grapher) also allows:
[✔] Build a graph in polar coordinates
[✔] Build a graph of a function which defined parametrically
It supports:
[✔] All mathematical functions. For example: sin (x), cos (x) exp (x), tan (x), the ctan (x), sqrt (x) and others.
[✔] Different arguments and options: a, b, c, etc.
The Calculator contain several features:
[✔] Several examples
[✔] Сorrect input expression errors
Examples of explored functions:
x/(x-1)
sin(x)*exp(-x)
[✔] The domain of the function
[✔] The intersection points with the X-axis coordinate
[✔] The intersection points with the Y-axis coordinate
[✔] Function extrema
[✔] Function inflection points
[✔] Vertical asymptotes
[✔] Horizontal asymptotes
[✔] Inclined asymptotes
[✔] Whether the function even or odd
[✔] Build a graph of a function
The calculator (as a plotter or grapher) also allows:
[✔] Build a graph in polar coordinates
[✔] Build a graph of a function which defined parametrically
It supports:
[✔] All mathematical functions. For example: sin (x), cos (x) exp (x), tan (x), the ctan (x), sqrt (x) and others.
[✔] Different arguments and options: a, b, c, etc.
The Calculator contain several features:
[✔] Several examples
[✔] Сorrect input expression errors
Examples of explored functions:
x/(x-1)
sin(x)*exp(-x)
Graph plotter and exploration Screenshots
Tap to Rate: