VatanTelekom Traffic
Ghost AppDev
Free
50+
downloads
About VatanTelekom Traffic
Say goodbye to your absence from monitoring the real consumption of your package (the graph):
Through this application, you can monitor the consumption of your packages (purchased from Watan Telecom) for each of the lines separately in addition to the sum of all the lines together.
Features:
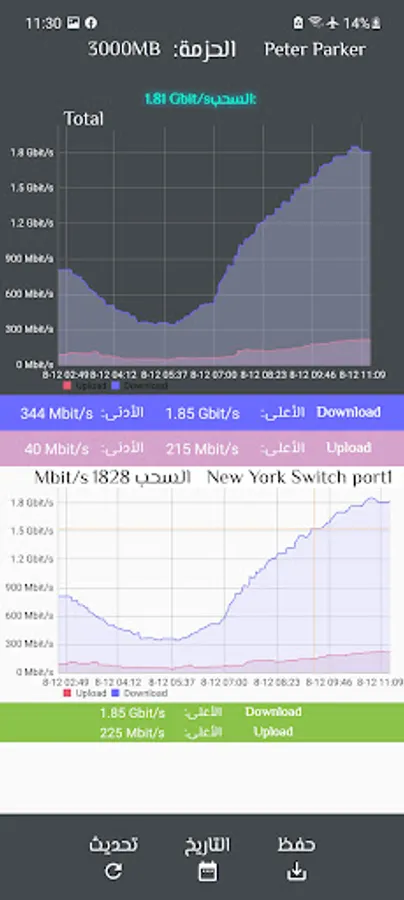
- View the drawing chart (graf) for simultaneous loading and lifting for each line individually.
- Display the sum of all charts in a single sum chart with a highly accurate calculation method.
- Display the purchased package limit on the sum chart to determine whether or not the package has been exceeded.
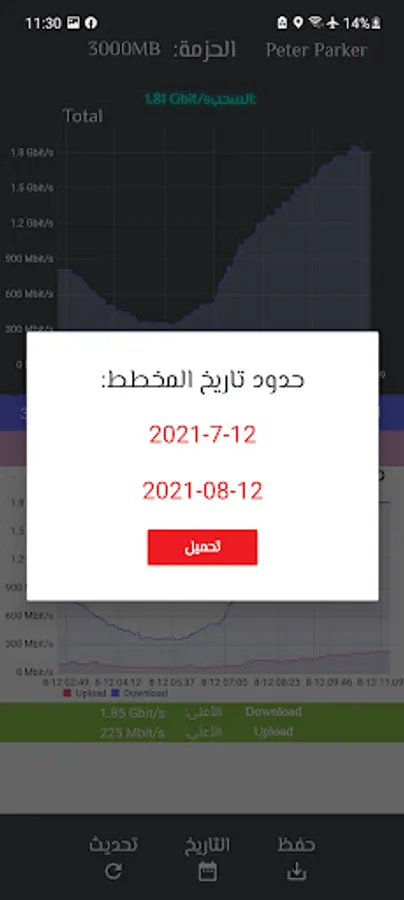
- Possibility to specify the time range for the start and end of the chart.
Displays the maximum and minimum loading and lifting values of the field in all charts.
- View the details and data of all your dishes.
All rights reserved to Watan Telecom.
VatanTelekom Traffic Screenshots
Tap to Rate:


