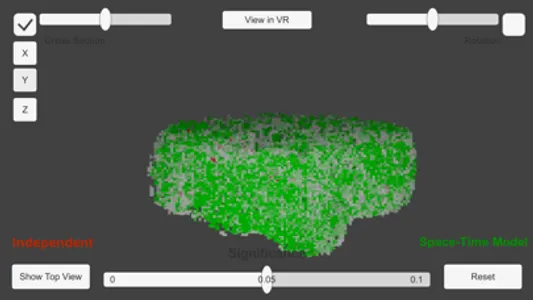
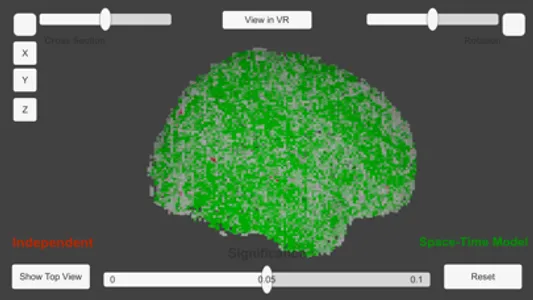
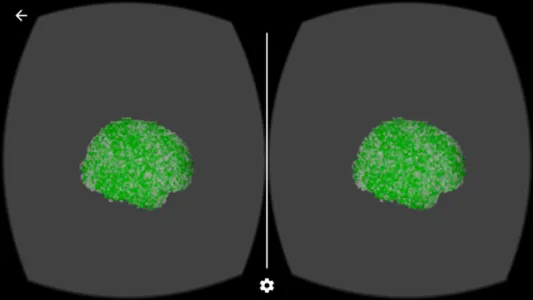
The app provides an interactive approach to visualize which areas of the brain are active in a subject that is performing a motor task. The differences between two p-value data sets are shown, one data set shows activated areas according to a traditional approach ("Independent"), and one with a new method proposed by scientists at KAUST and Newcastle University ("Space Time Model").
Green represent areas where the proposed Space Time Model produces lower p-values.
Red represents areas where the traditional method produces lower p-values.
White suggests the two model produce similar p-values.
Green represent areas where the proposed Space Time Model produces lower p-values.
Red represents areas where the traditional method produces lower p-values.
White suggests the two model produce similar p-values.
Show More


