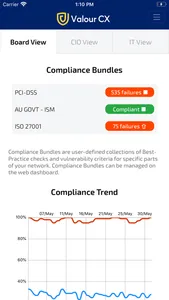
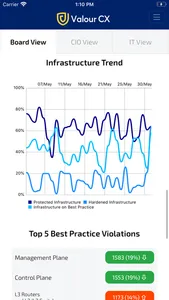
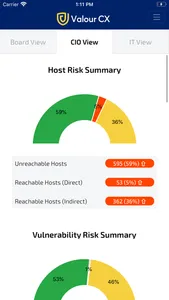
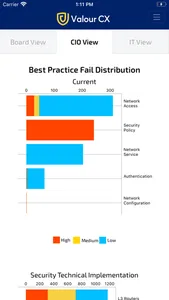
Valour CX’s Cybersecurity Compliance Dashboard simplifies the achievement of compliance by putting key compliance and technology risk metrics into focus. The dashboard offers a consolidated view of compliance, best practice and vulnerability data for the organisation's network infrastructure with admin-customisable tabs that highlight the metrics relevant to the stakeholder.
The Dashboard offers three views:
Board View
Provides executive-level stakeholders with a snapshot of their organisation’s compliance with the standards and frameworks that are relevant to their business and operations
• Compliance is assessed on a daily basis
• Stakeholders can browse compliance failures
• Compliance assessment trends for the previous month, quarter, year and two years are plotted in a graph
• Metrics for infrastructure protection, hardening and adherence to industry best practices are also reported daily and trends plotted
CIO View
Provides C-level stakeholders with an in-depth analysis of their host and network risk posture, together with a breakdown of the best-practice failures across the network infrastructure for which they are responsible
• Analysis is conducted on a daily basis & changes from the previous 24 hours are colour-coded for ease of reference
• Best-practice failures are classified by type and colour-coded on severity
• Stakeholders can compare metric distribution across their RedSeal instances
• Summary metrics are presented in quantitive and percentage form
• Additional key metrics are summarised in a collection of “Top 5” tables
• Tabular data can be presented in doughnut chart form
IT View
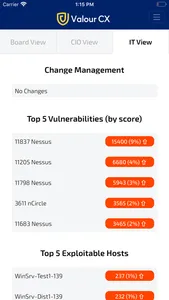
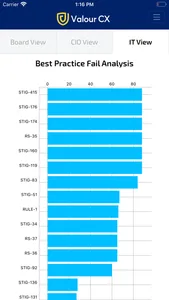
Provides network security and operations staff with a prioritised view of the poorly configured network infrastructure they need to secure and harden against vulnerabilities
• Includes daily change management analysis
• Provides a “Top 5” analysis of the most critical vulnerabilities, exploitable hosts and poorly configured devices
• All metrics feature a drill-down capability, expanding on the “Top 5” items for in-depth analysis and response
• Codes for vulnerabilities and best practices are shown, together with device/host name information, for ease of retrieval/assessment in RedSeal and other systems
Show More
