AppRecs review analysis
AppRecs rating 4.4. Trustworthiness 82 out of 100. Review manipulation risk 35 out of 100. Based on a review sample analyzed.
★★★★☆
4.4
AppRecs Rating
Ratings breakdown
5 star
79%
4 star
5%
3 star
0%
2 star
5%
1 star
11%
What to know
✓
Credible reviews
82% trustworthiness score from analyzed reviews
✓
High user satisfaction
84% of sampled ratings are 4+ stars (4.4★ average)
About Scope AUv3 Visualizer
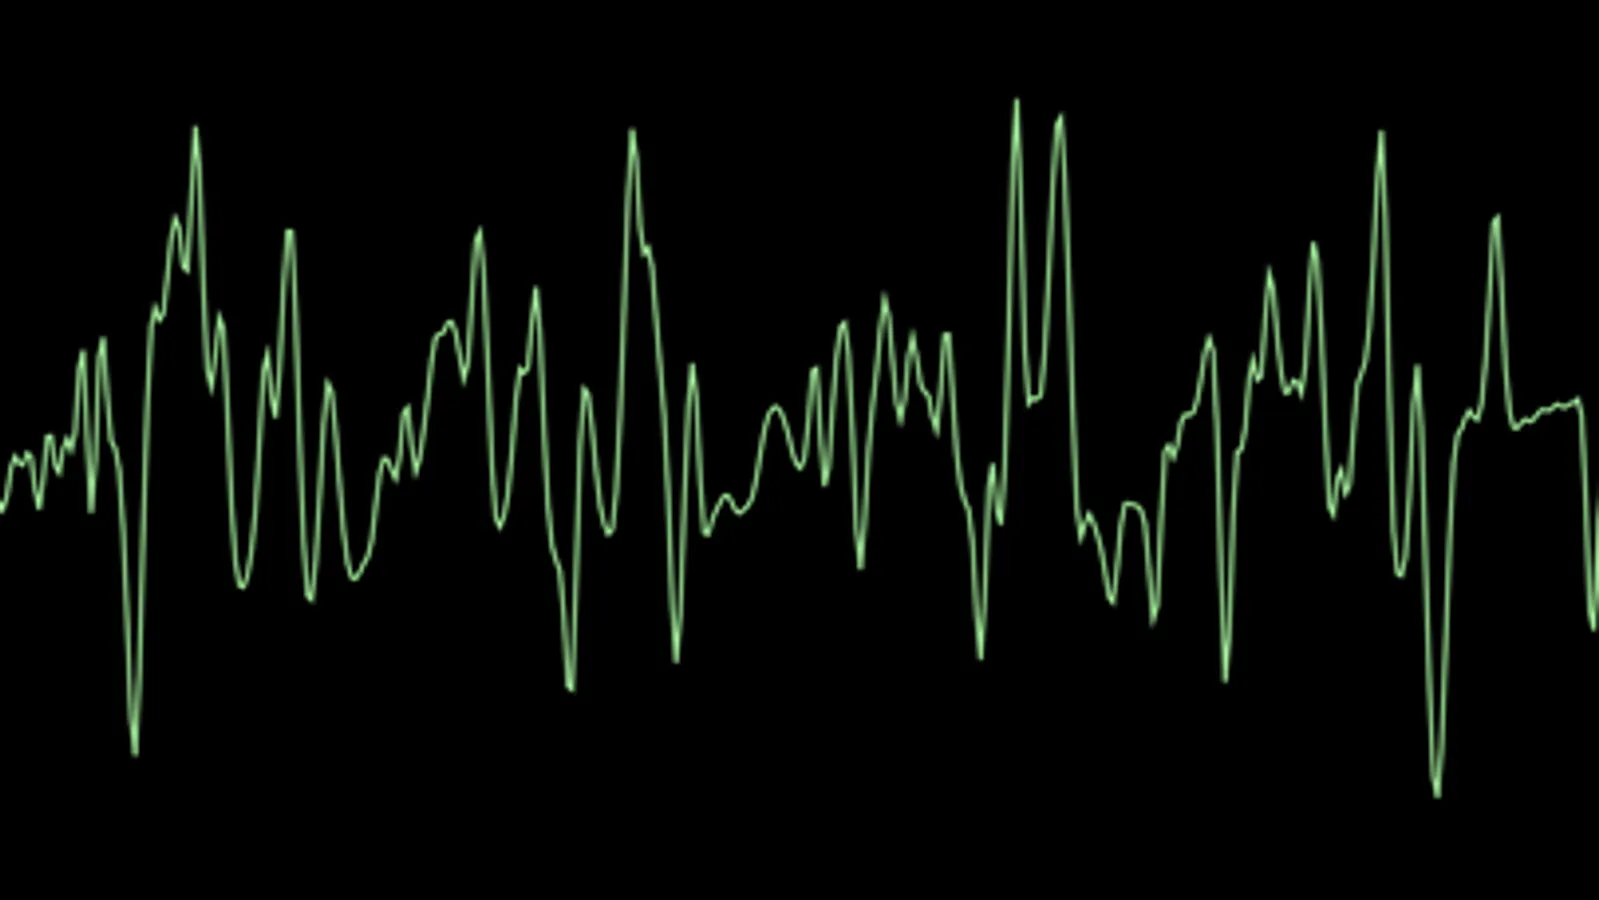
Get professional audio visualization with your AUv3 host or the standalone app. Scope transforms your audio into stunning visual displays using GPU-accelerated graphics with classic phosphor glow effects reminiscent of vintage CRT oscilloscopes.
Featuring both traditional linear and mesmerizing circular waveform modes, Scope offers multiple color schemes (including classic phosphor green and vibrant 80s Red) with smooth transitions. The intuitive iOS touch interface includes tap-to-toggle controls, two-finger tap for pause/play, horizontal swipe gestures to change color schemes, and pinch-to-zoom with multi-directional scaling.
Optimized for HiDPI Retina displays with dynamic line width scaling, Scope delivers smooth 60fps+ performance for live performances, creative sound design, and professional audio monitoring. Whether you're analyzing dynamics during mixing, assisting with sound synthesis, or adding visual interest to your sessions, Scope provides the precision and aesthetic flexibility you need. Place it anywhere in your signal chain to visualize audio at any point, though it's typically used last to analyze the cumulative effects of your processing chain.
