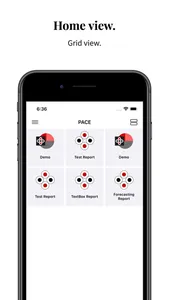
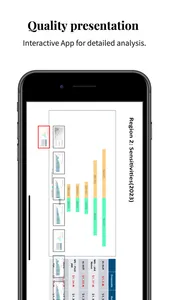
* PharmaACE’s flagship reporting & forecasting tool is now available as an iOS & iPadOS app! Clean & intuitive UI, super fast and super light for all your reporting needs.
* Pace-BI app gives you access to familiar slideshow presentations quickly and easily from anywhere.
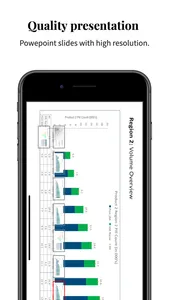
* Need to access you presentation slides quickly while on the go? Quick view to your recent slides and presentation for easy access on any device is provided here on Pace-BI.
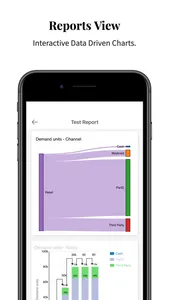
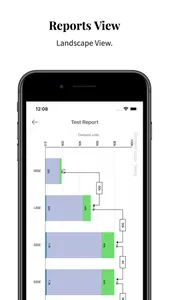
* Pace-BI app gives easy access to reports with highly customised charts, powerful, fast and accurate charts which helps you analyse and review for better forecasting. Data driven charts with multiple sheets and various forms of presentations, feature to play around your charts and data manipulation with filter option with huge data sets.
* Data safety is given priority for end user, a completely secure Pace-BI experience when you sign in with our hassle-free federated login.
* Key features:
* Interactive App for detailed analysis.
* Power Point slides with high resolution presentation.
* Interactive Data Driven Real Time Charts.
* Visual and Insightful Tables.
* Flexible User Interface.
Show More

