AppRecs review analysis
AppRecs rating . Trustworthiness 75 out of 100. Review manipulation risk 21 out of 100. Based on a review sample analyzed.
★
AppRecs Rating
Ratings breakdown
5 star
100%
4 star
0%
3 star
0%
2 star
0%
1 star
0%
What to know
✓
Low review manipulation risk
21% review manipulation risk
✓
Credible reviews
75% trustworthiness score from analyzed reviews
✓
High user satisfaction
100% of sampled ratings are 5 stars
About Bar Chart Maker
Key Features:
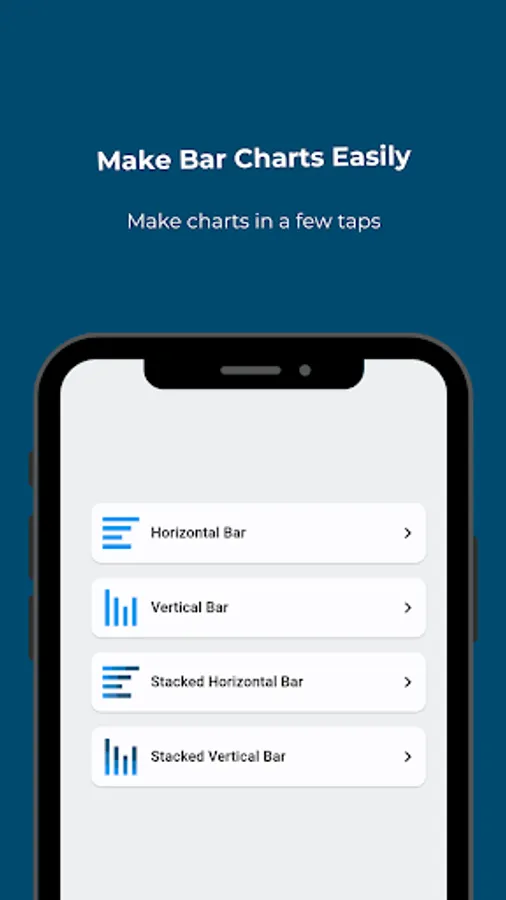
1. Vertical Bar Charts: Create vertical bar charts effortlessly to represent your data in a clear and organized manner. Choose from various customization options to tailor the chart to your needs.
2. Horizontal Bar Charts: For a different perspective, opt for horizontal bar charts, perfect for comparing data points horizontally.
3. Stacked Vertical Bar Charts: Visualize multiple datasets simultaneously using stacked vertical bar charts. This feature helps you explore the composition of various data categories within a single chart.
4. Stacked Horizontal Bar Charts: Similar to stacked vertical charts, this feature enables you to display stacked data in a horizontal format, making it easier to showcase data relationships.
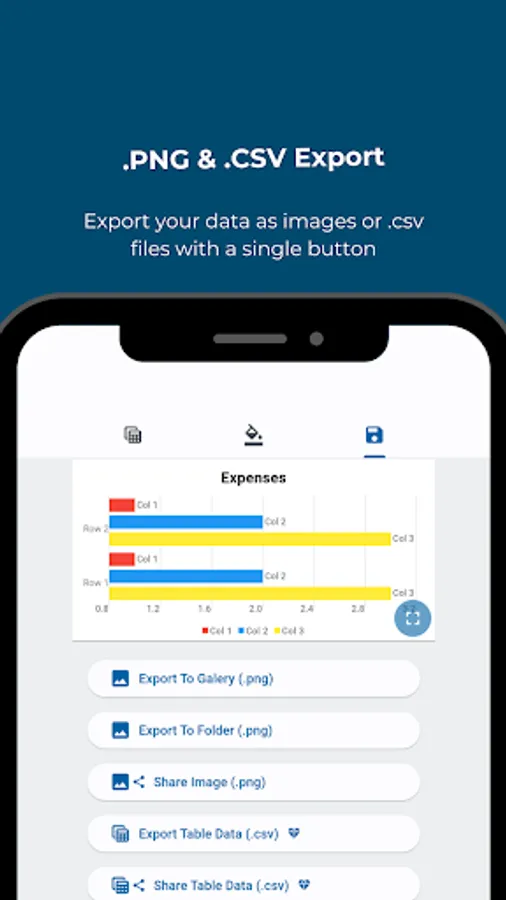
5. Export as Image: Turn your chart into a high-quality image with just a few clicks. Share your charts in reports, presentations, or online with ease.
6. Export Data as .CSV: Seamlessly export your data as a .csv file for further analysis or sharing with colleagues, ensuring your insights are accessible to everyone.
7. Simple UI: Our user-friendly interface is designed for users of all levels, making it easy to navigate and create beautiful charts without any technical expertise.
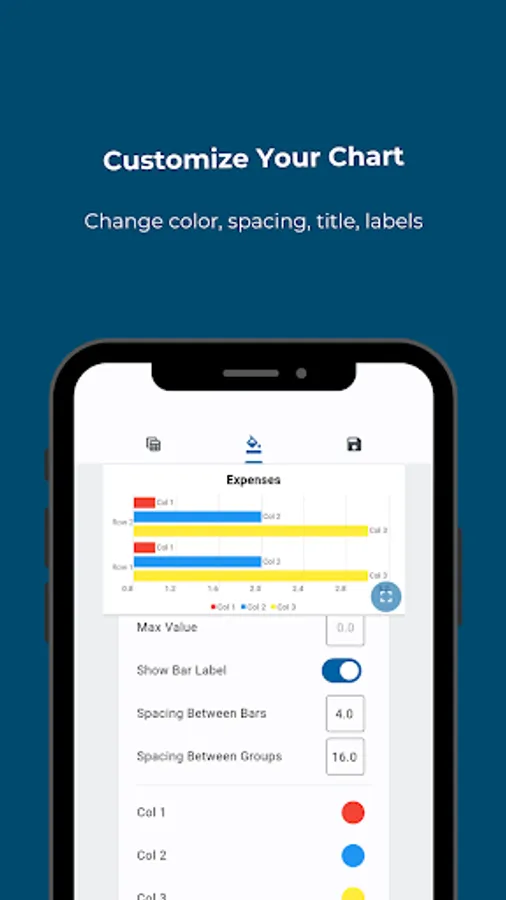
8. Chart Customization: Tailor your charts to match your unique style and requirements. Customize colors, labels, titles, and more to create the perfect visual representation of your data.
1. Vertical Bar Charts: Create vertical bar charts effortlessly to represent your data in a clear and organized manner. Choose from various customization options to tailor the chart to your needs.
2. Horizontal Bar Charts: For a different perspective, opt for horizontal bar charts, perfect for comparing data points horizontally.
3. Stacked Vertical Bar Charts: Visualize multiple datasets simultaneously using stacked vertical bar charts. This feature helps you explore the composition of various data categories within a single chart.
4. Stacked Horizontal Bar Charts: Similar to stacked vertical charts, this feature enables you to display stacked data in a horizontal format, making it easier to showcase data relationships.
5. Export as Image: Turn your chart into a high-quality image with just a few clicks. Share your charts in reports, presentations, or online with ease.
6. Export Data as .CSV: Seamlessly export your data as a .csv file for further analysis or sharing with colleagues, ensuring your insights are accessible to everyone.
7. Simple UI: Our user-friendly interface is designed for users of all levels, making it easy to navigate and create beautiful charts without any technical expertise.
8. Chart Customization: Tailor your charts to match your unique style and requirements. Customize colors, labels, titles, and more to create the perfect visual representation of your data.
Bar Chart Maker Screenshots
Tap to Rate:
Reviews for Bar Chart Maker
Anuradha Kushwaha
6/5/2025
My experience was very good with this app you guys can use it It creates very quick and accurate graphs , thank you so much 🙏