About Data Fidget
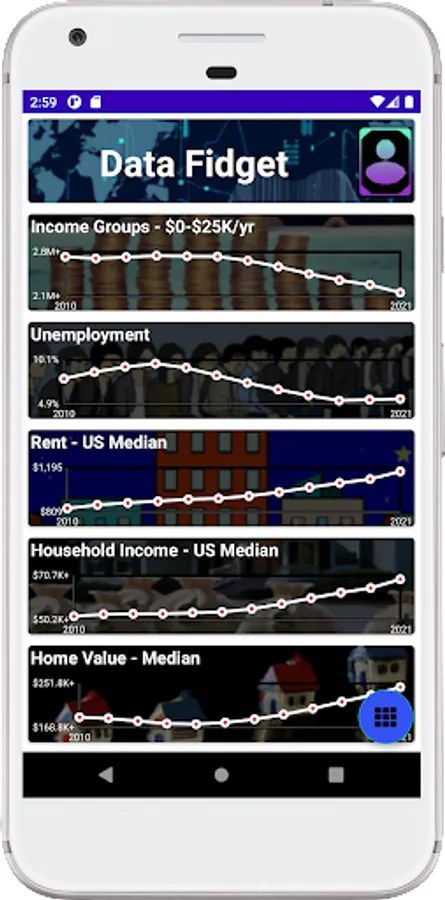
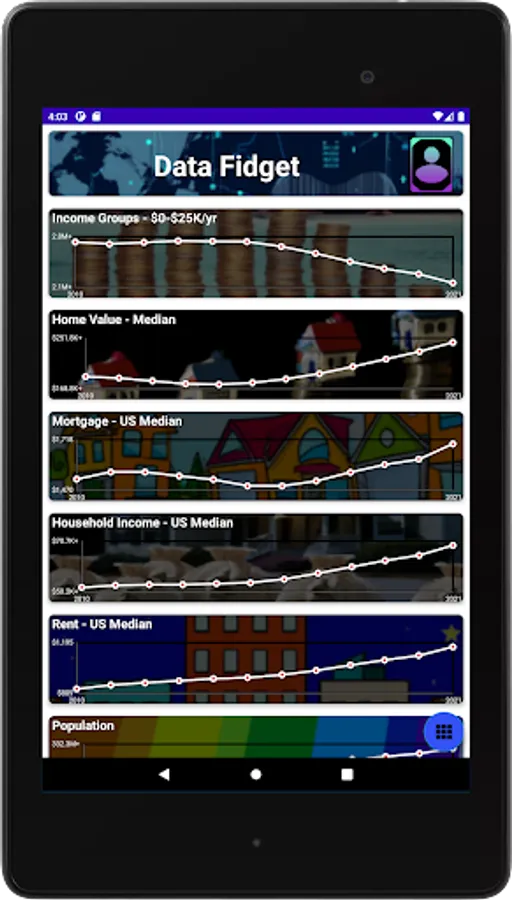
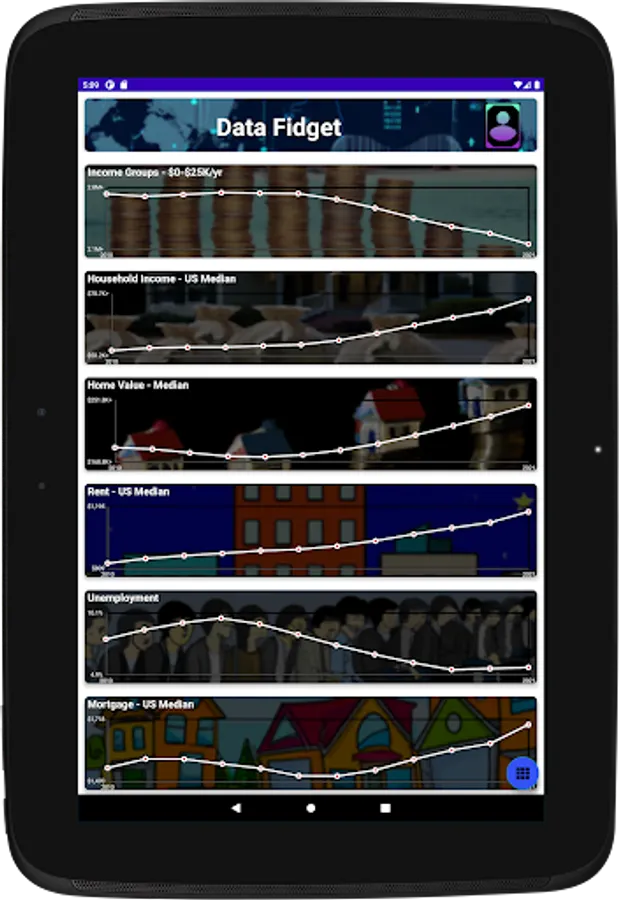
Map, graph, explore and analyze income, housing, social, and demographic data sets throughout the United States. Quickly and easily access annual data sets since 2010 with nine informative datasets including household income, rent, mortgage, poverty, unemployment, home value and more. Get data insights to help you better understand data trends around you and across the United States. Enjoy hopping from dataset to dataset and modify maps and graphs with ease. Whether for professional or personal use, Data Fidget’s design allows anyone to easily access essential information to support business needs or satisfy their curiosities.
All datasets include access to data at the national, state, and county levels since 2010. Currently Data Fidget offers the Income Data Pack, a collection of datasets that will help you understand financial trends throughout the United States. The Income Data Pack includes the following datasets:
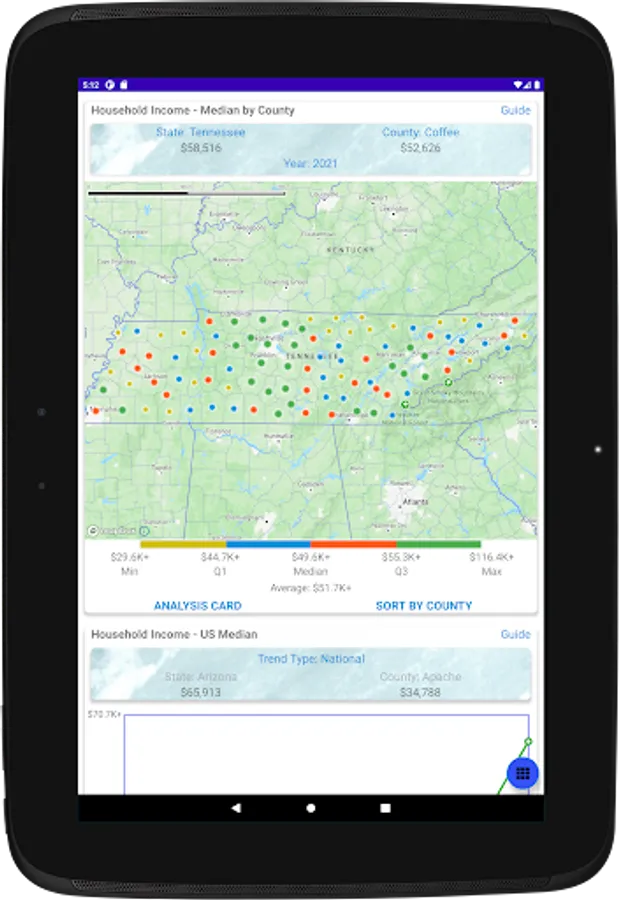
- Household Income
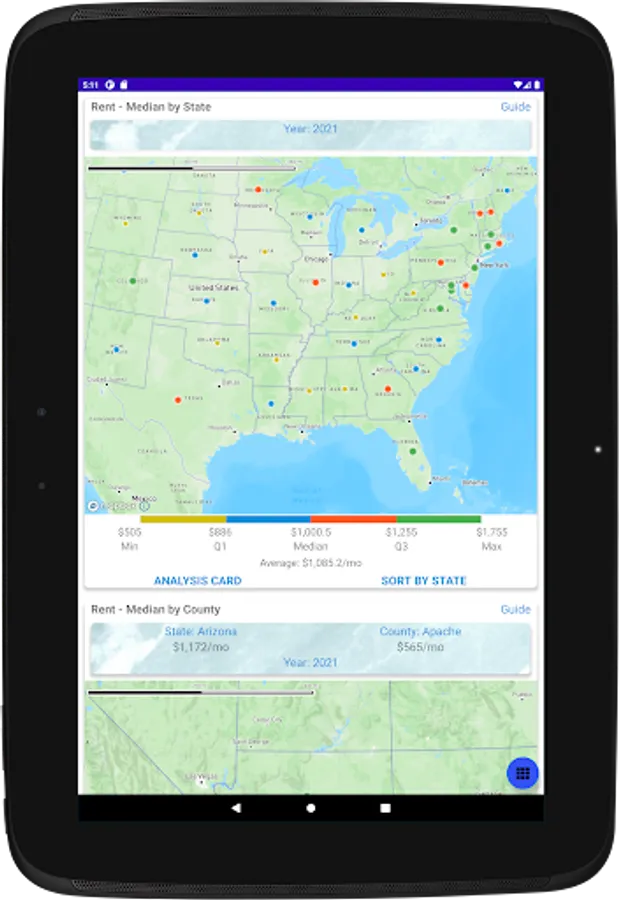
- Rent
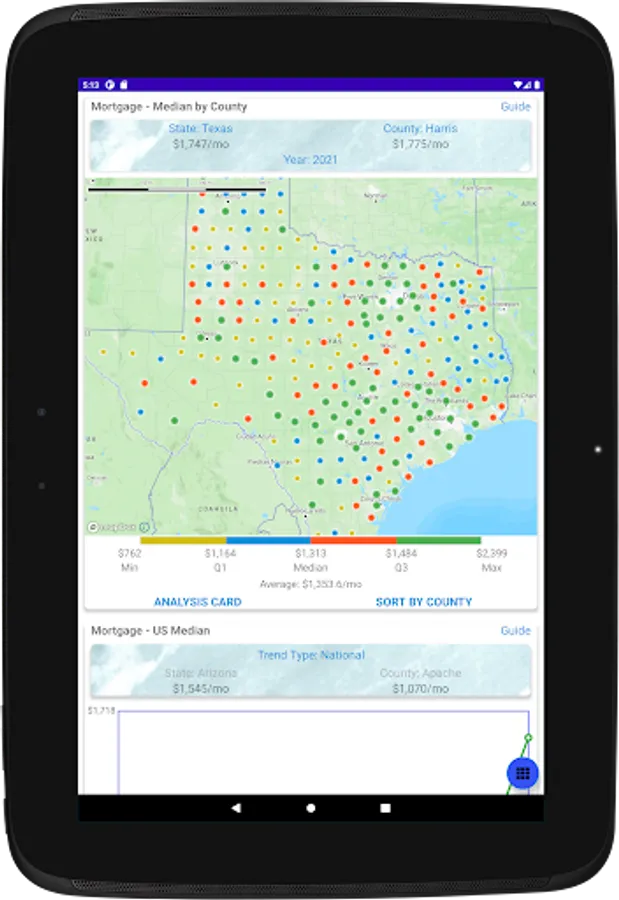
- Mortgage
- Home Value
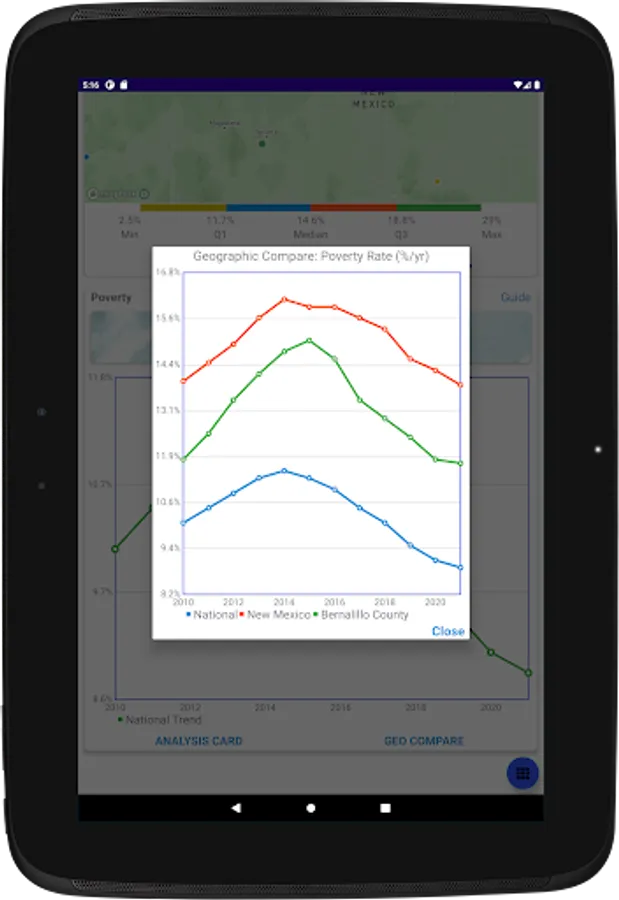
- Poverty
- Unemployment
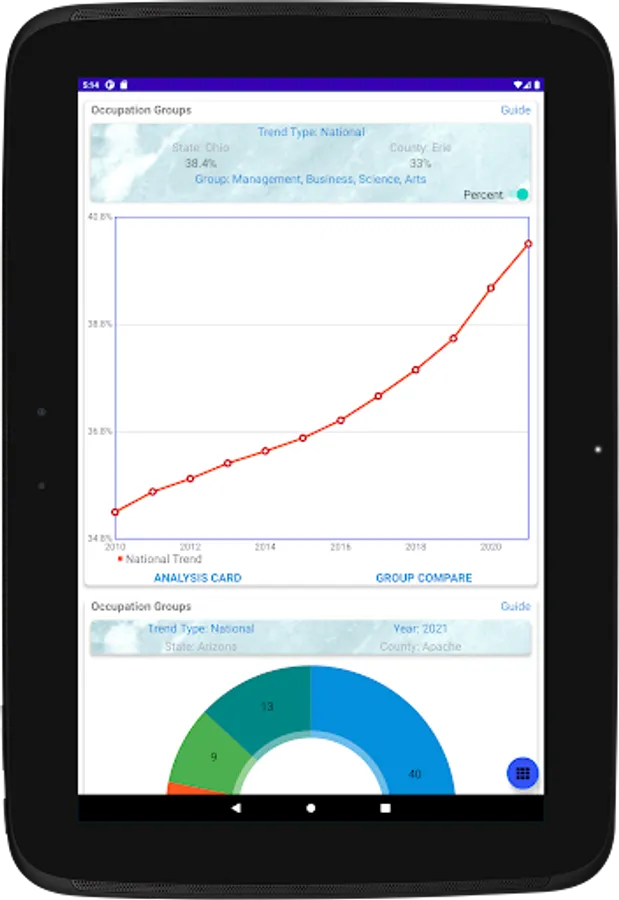
- Occupation Groups
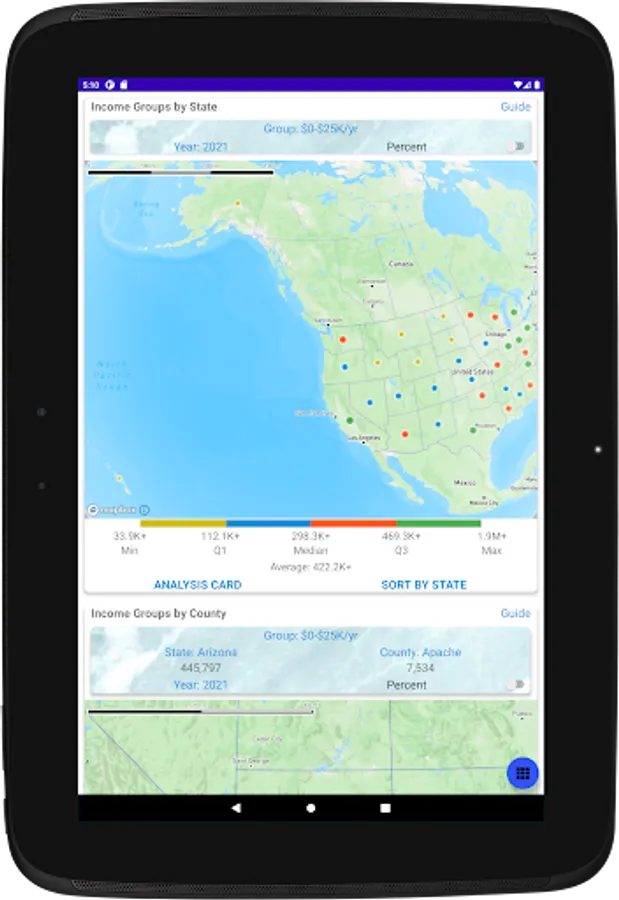
- Income Groups
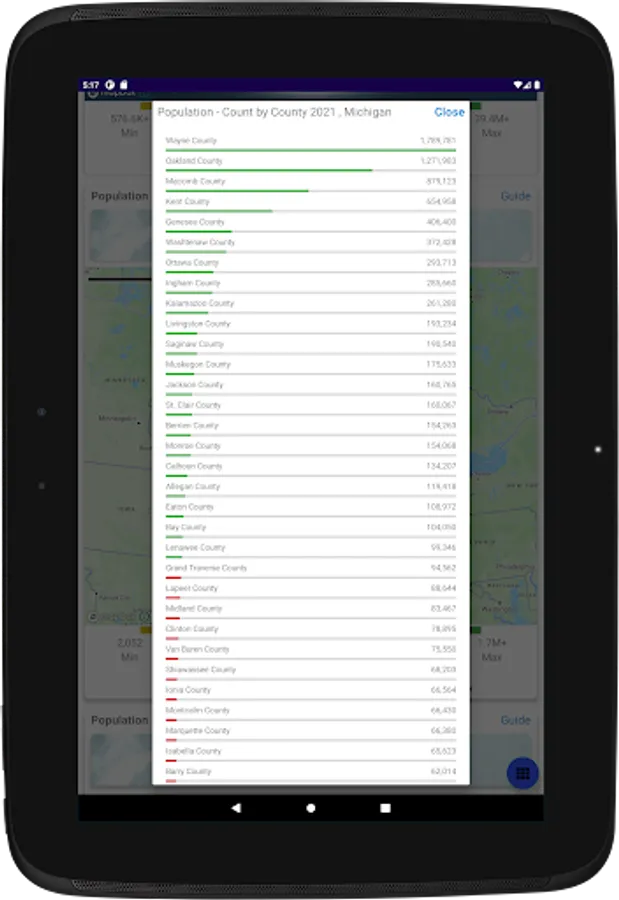
- Population
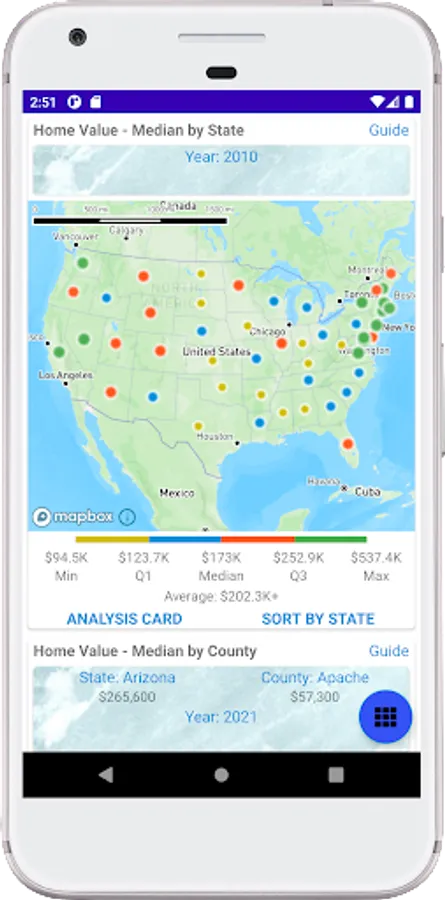
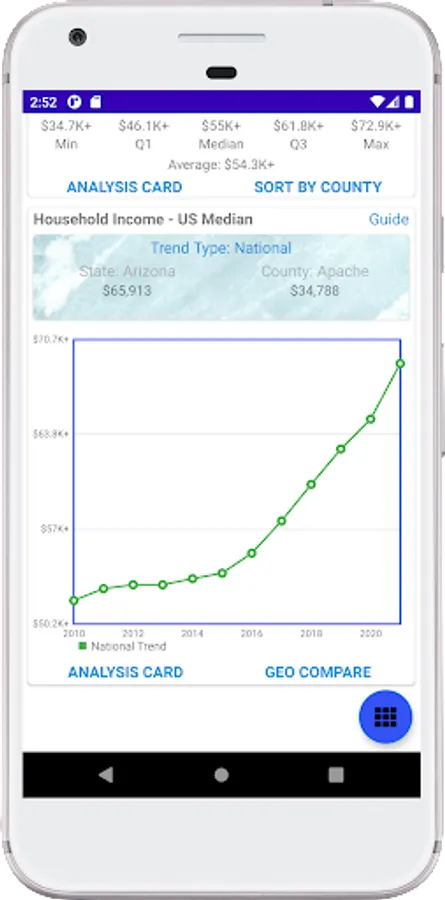
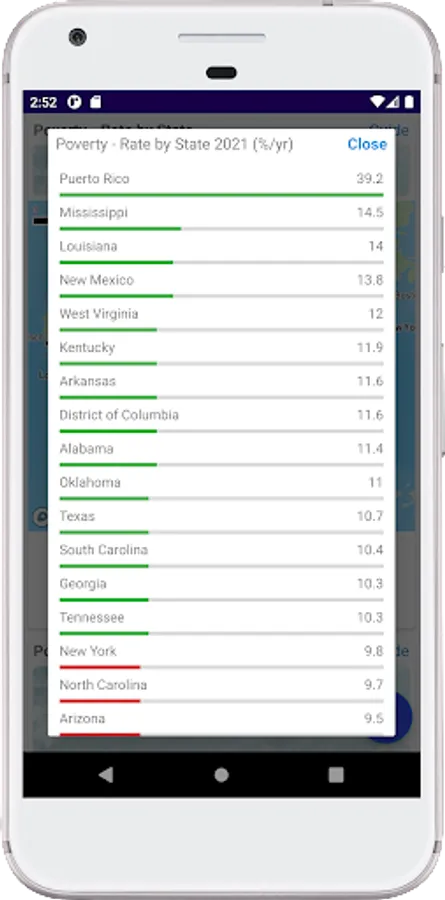
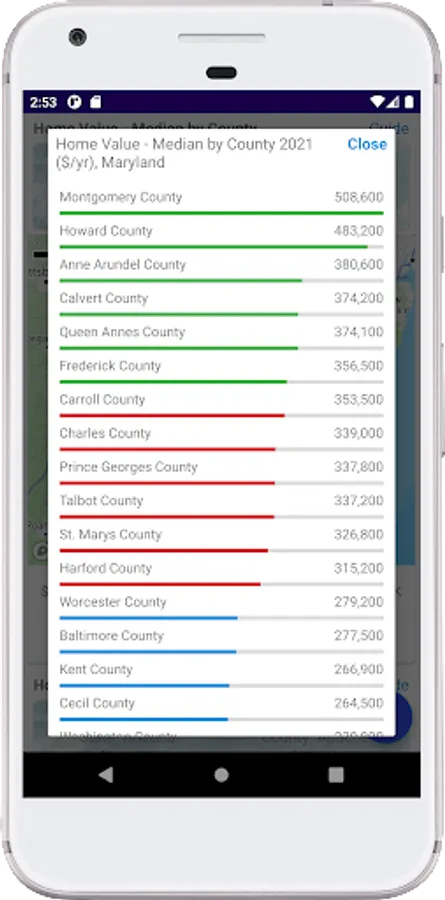
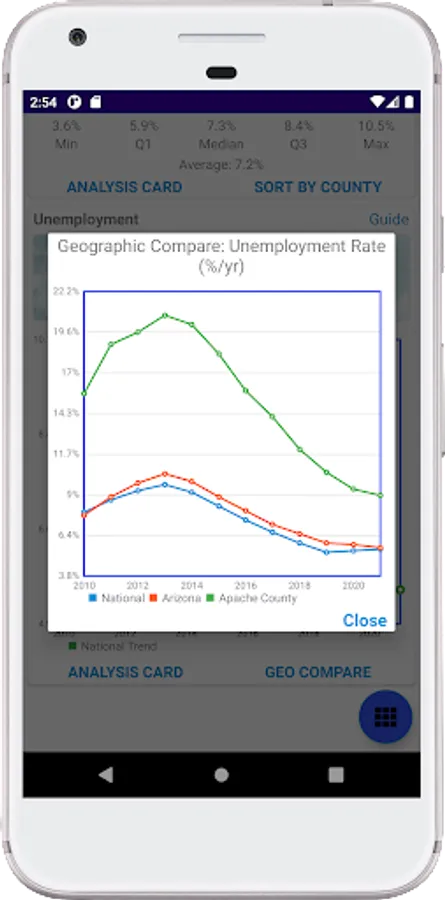
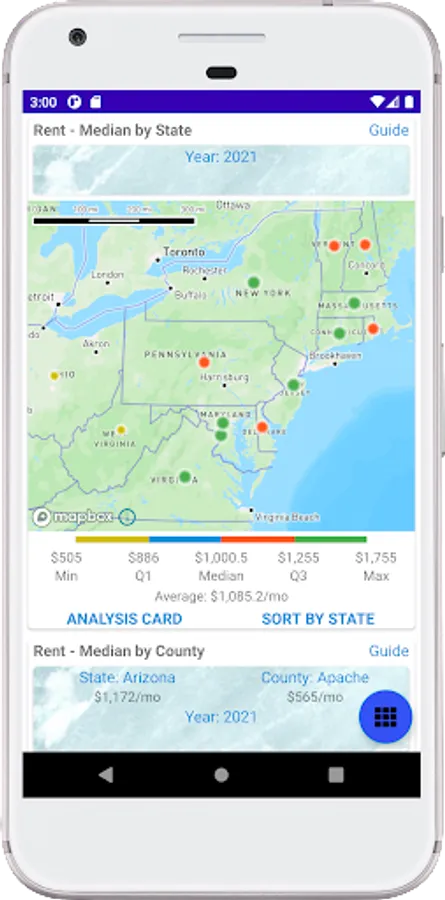
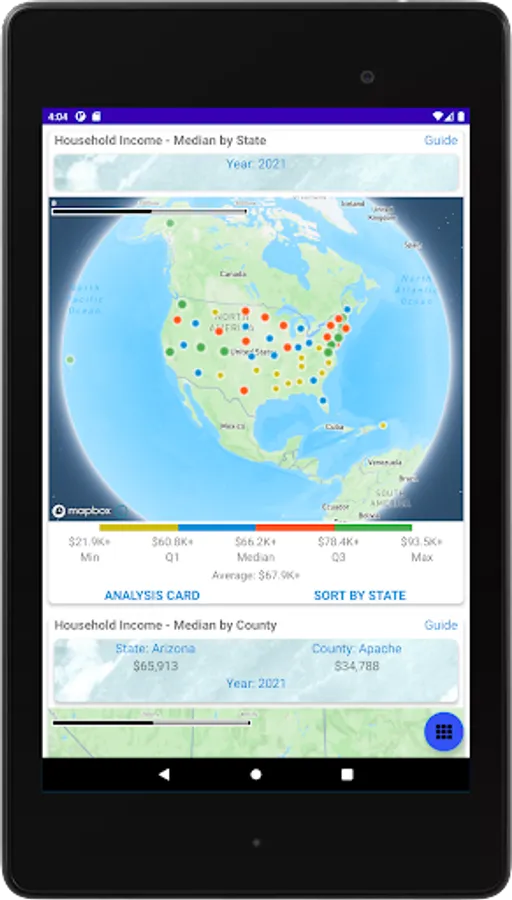
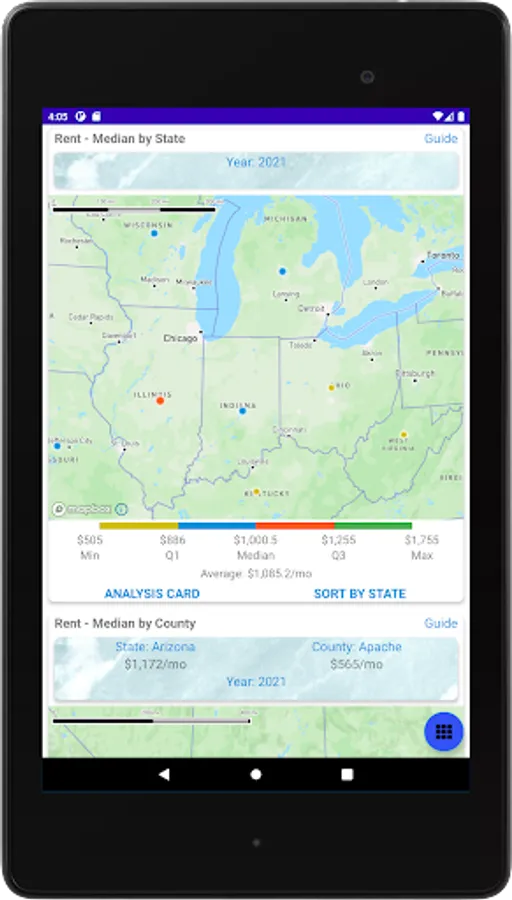
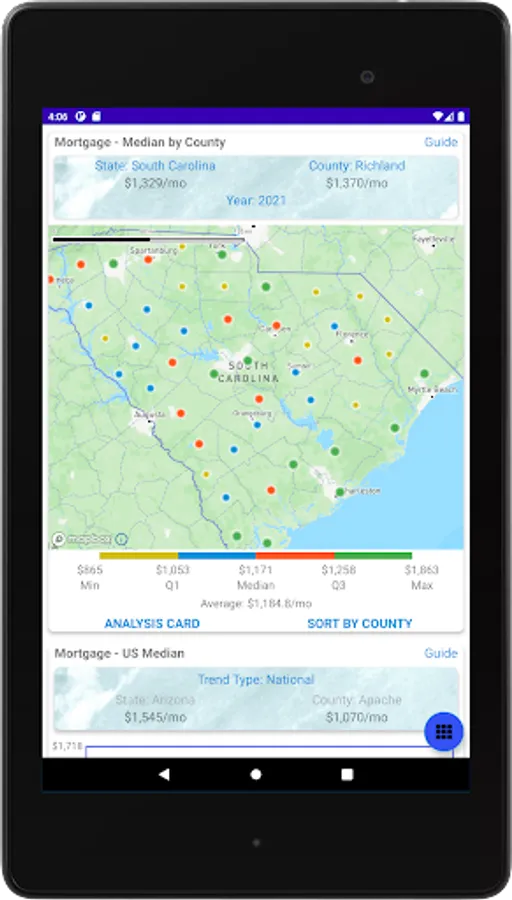
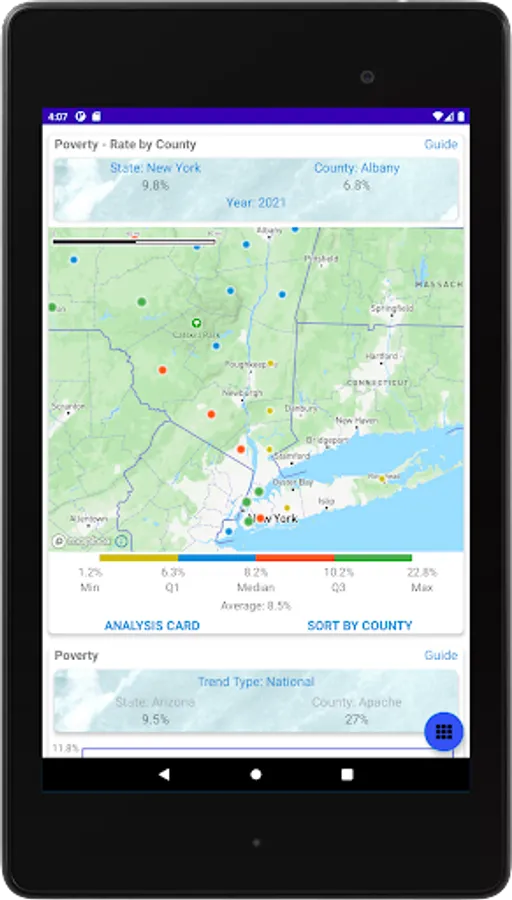
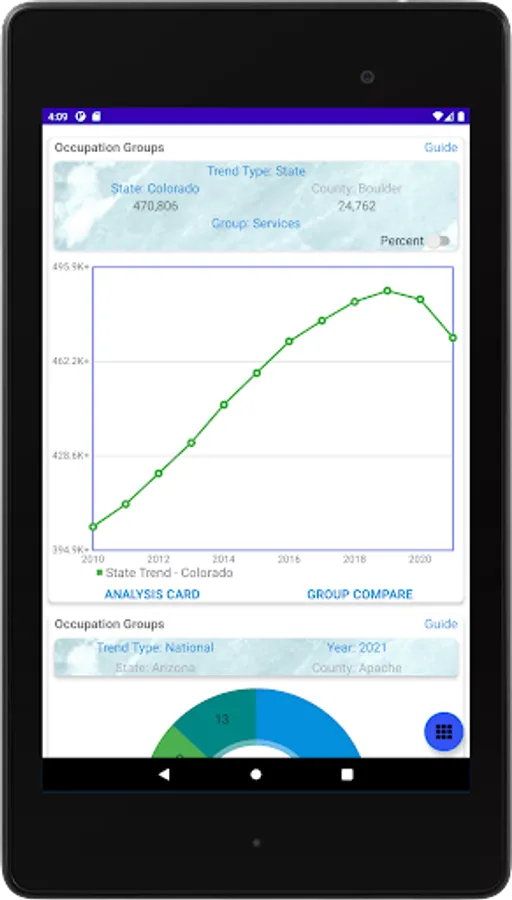
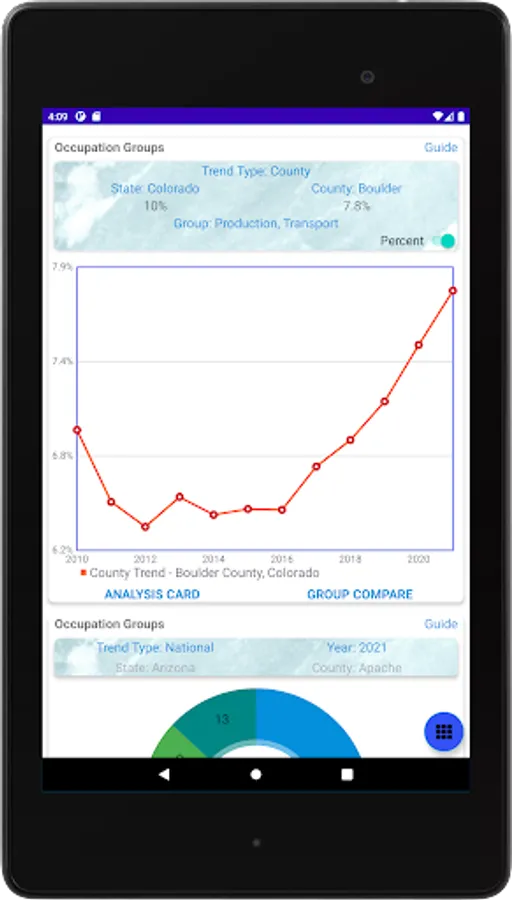
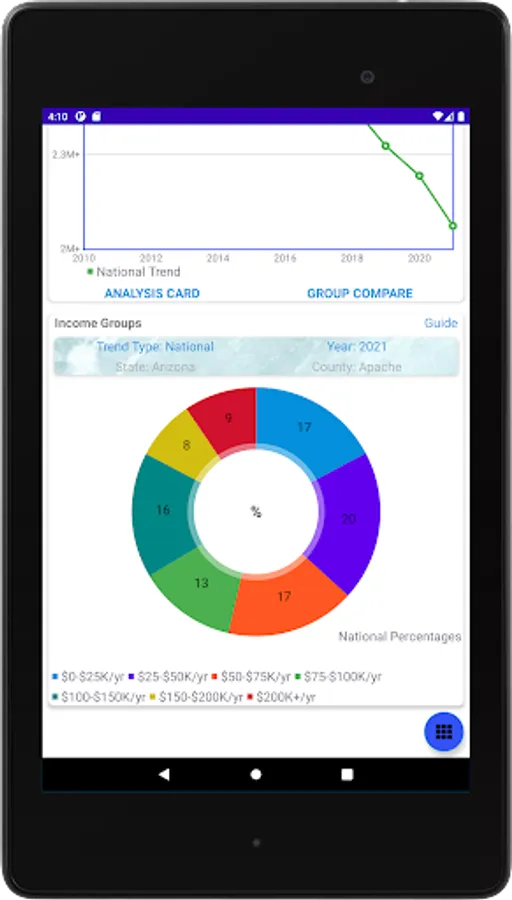
To access the free version of the Data Fidget app simply download the app from google play. The Free Version allows you to map the above datasets by state and create line graphs for national, state and county geographies throughout the United States. From the national maps you can view different years and for grouped datasets you can view the data in a count or percentage format. Using the custom map symbology you can quickly identify spatial trends and compare the highest values to the lowest values. From the line graph you can generate an annual line chart going back to 2010 for the nation or any state or county as well as use the compare tools to quickly compare national, state, and county annual trends.
Free Trial and Subscriptions: All new users can access a two week free trial to explore all of the app capabilities and benefits. After the free trial you will be charged the current monthly rate, you can cancel the free trial or subscription anytime. Under the free trial or a subscription you will have access to the following capabilities and benefits:
- No Ads
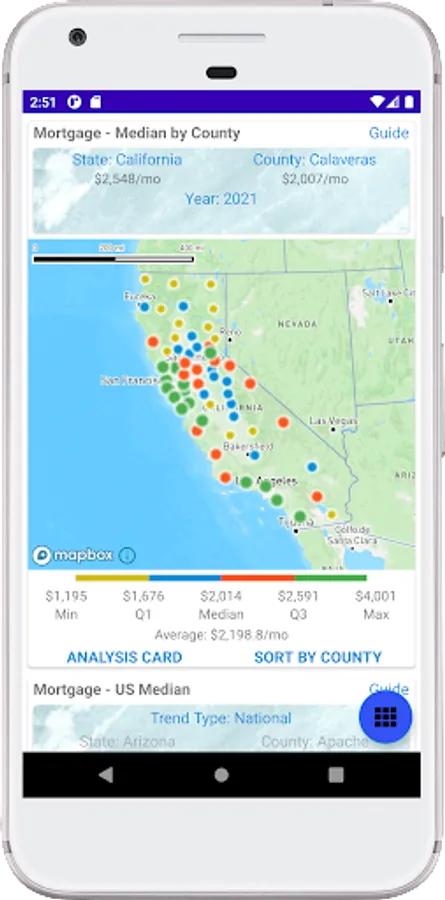
- County Level Maps - Explore values by county for a selected state and identify spatial trends at a higher resolution.
- Regression Analysis - Identify annual and cross dataset relationships. Generate an analysis graph with trend line and r-squared value. You can also perform regression analysis between any two datasets. This will allow you to identify potential relationships between datasets as well as relationship strength.
- R-Squared Mapping Analysis - Spatially compare regression analysis r-squared results to identify relationship trends by state and county. This tool can be used to display which locations have stronger positive or negative relationships for your current analysis.
- Prediction - Explore predictions based on annual and cross dataset regression analysis. You can modify the year range, predict range and analysis type to generate a wide variety of prediction trend lines. Compare r-squared values and results determine the strongest trend models.
By using this app you consent to our Terms and Conditions and Privacy Policy. Our Terms and Conditions and Privacy Policy can be referenced in the app or on the Data Fidget website www.datafidget.com.
This product uses Census Bureau Data but is not endorsed or certified by the Census Bureau.
All datasets include access to data at the national, state, and county levels since 2010. Currently Data Fidget offers the Income Data Pack, a collection of datasets that will help you understand financial trends throughout the United States. The Income Data Pack includes the following datasets:
- Household Income
- Rent
- Mortgage
- Home Value
- Poverty
- Unemployment
- Occupation Groups
- Income Groups
- Population
To access the free version of the Data Fidget app simply download the app from google play. The Free Version allows you to map the above datasets by state and create line graphs for national, state and county geographies throughout the United States. From the national maps you can view different years and for grouped datasets you can view the data in a count or percentage format. Using the custom map symbology you can quickly identify spatial trends and compare the highest values to the lowest values. From the line graph you can generate an annual line chart going back to 2010 for the nation or any state or county as well as use the compare tools to quickly compare national, state, and county annual trends.
Free Trial and Subscriptions: All new users can access a two week free trial to explore all of the app capabilities and benefits. After the free trial you will be charged the current monthly rate, you can cancel the free trial or subscription anytime. Under the free trial or a subscription you will have access to the following capabilities and benefits:
- No Ads
- County Level Maps - Explore values by county for a selected state and identify spatial trends at a higher resolution.
- Regression Analysis - Identify annual and cross dataset relationships. Generate an analysis graph with trend line and r-squared value. You can also perform regression analysis between any two datasets. This will allow you to identify potential relationships between datasets as well as relationship strength.
- R-Squared Mapping Analysis - Spatially compare regression analysis r-squared results to identify relationship trends by state and county. This tool can be used to display which locations have stronger positive or negative relationships for your current analysis.
- Prediction - Explore predictions based on annual and cross dataset regression analysis. You can modify the year range, predict range and analysis type to generate a wide variety of prediction trend lines. Compare r-squared values and results determine the strongest trend models.
By using this app you consent to our Terms and Conditions and Privacy Policy. Our Terms and Conditions and Privacy Policy can be referenced in the app or on the Data Fidget website www.datafidget.com.
This product uses Census Bureau Data but is not endorsed or certified by the Census Bureau.