Bluetooth Terminal/Graphics +
Emrecan ÇETİN
1.5 ★
store rating
500+
downloads
$3.99
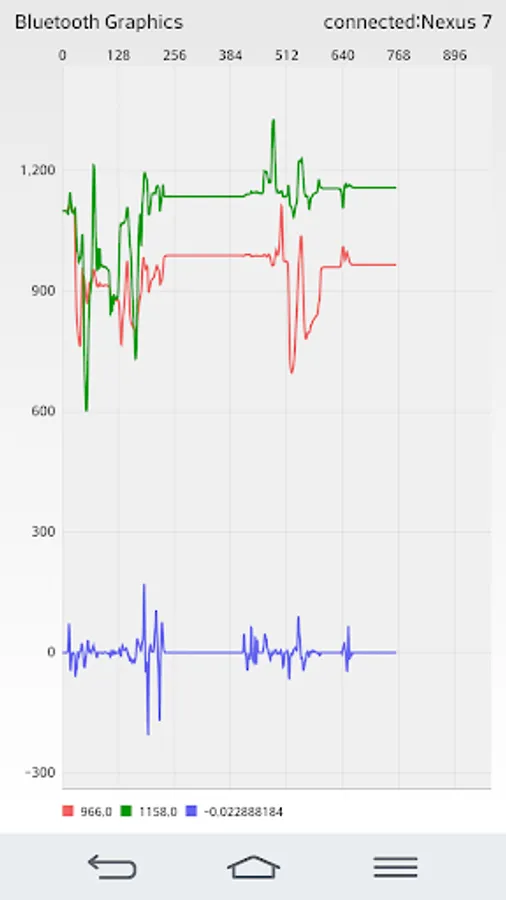
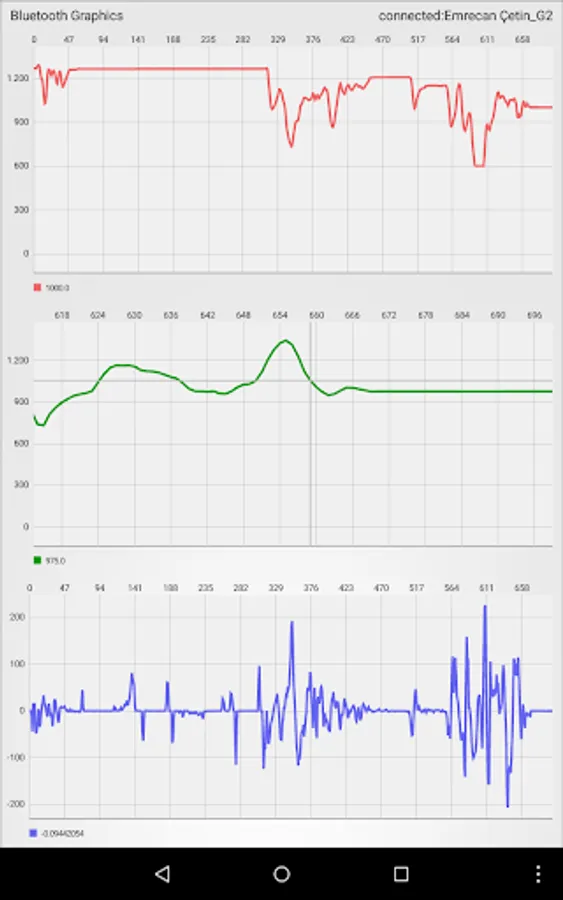
With this Bluetooth Terminal/Graphics+ app, you can connect to microcontrollers via Bluetooth, monitor serial data, and view real-time graphical representations of up to seven variables. Includes customizable data separation, autoscaled graphs, and data logging features.
AppRecs review analysis
AppRecs rating 1.5. Trustworthiness 77 out of 100. Review manipulation risk 26 out of 100. Based on a review sample analyzed.
★☆☆☆☆
1.5
AppRecs Rating
Ratings breakdown
5 star
0%
4 star
0%
3 star
0%
2 star
50%
1 star
50%
What to know
✓
Low review manipulation risk
26% review manipulation risk
✓
Credible reviews
77% trustworthiness score from analyzed reviews
⚠
Mixed user feedback
Average 1.5★ rating suggests room for improvement
About Bluetooth Terminal/Graphics +
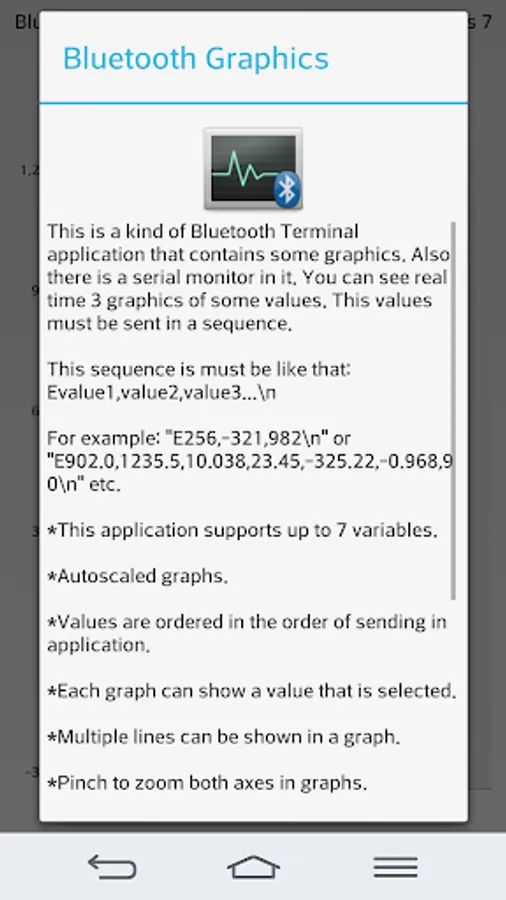
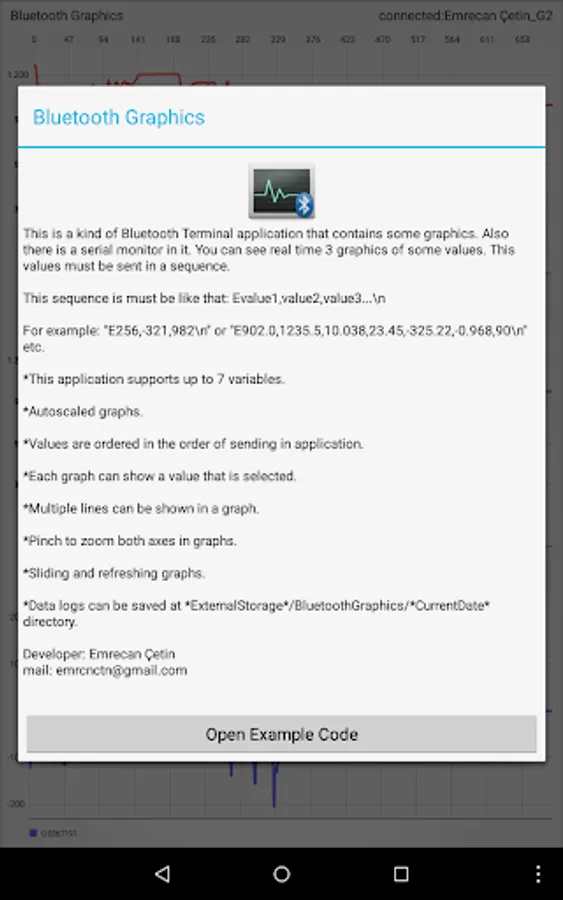
This is a kind of Bluetooth Terminal application that contains some graphics.
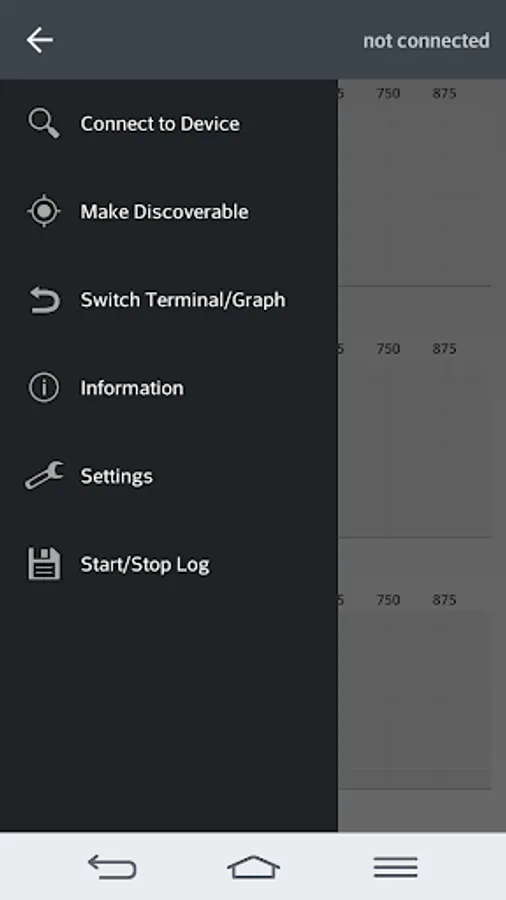
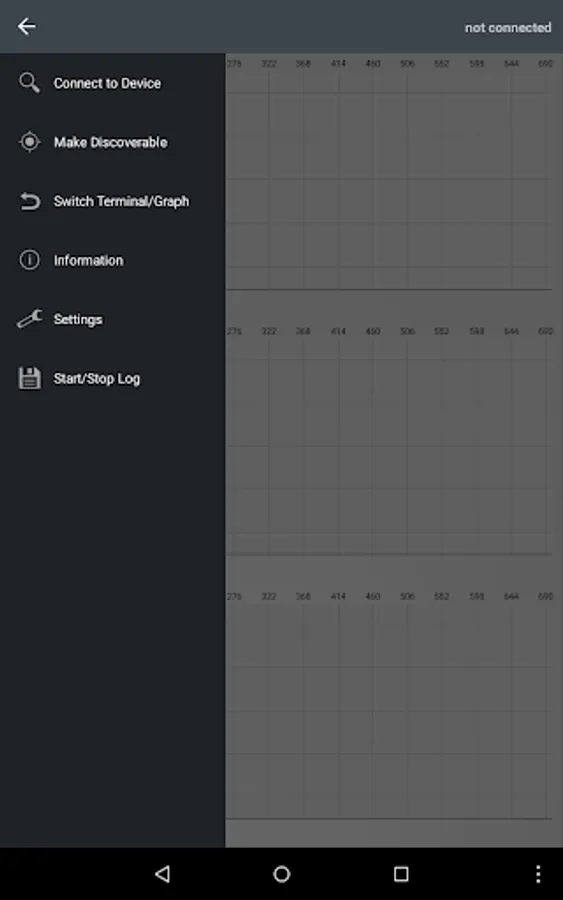
Also there is a serial monitor in it.
You can use this app with arduino or another microcontroller for your robotics projects and etc.
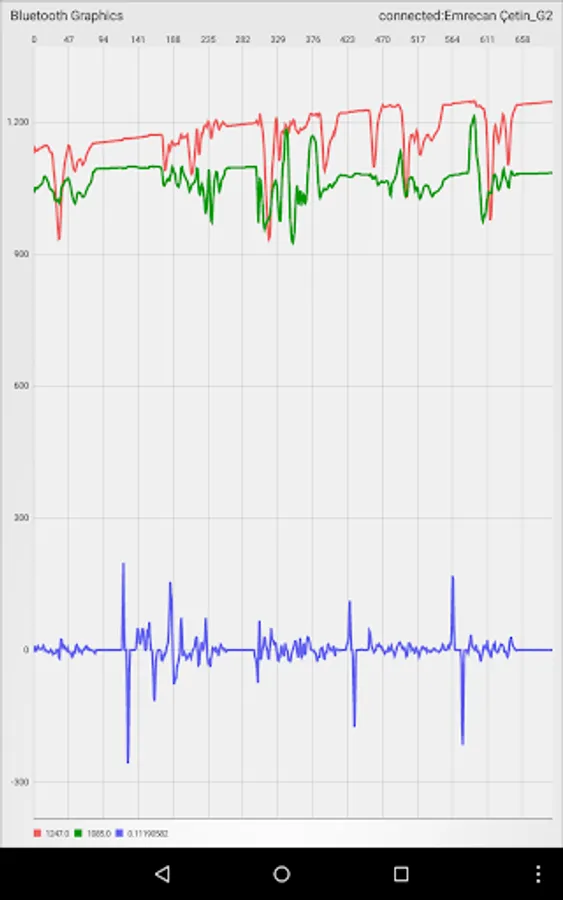
You can see real time 7 graphics of some values.
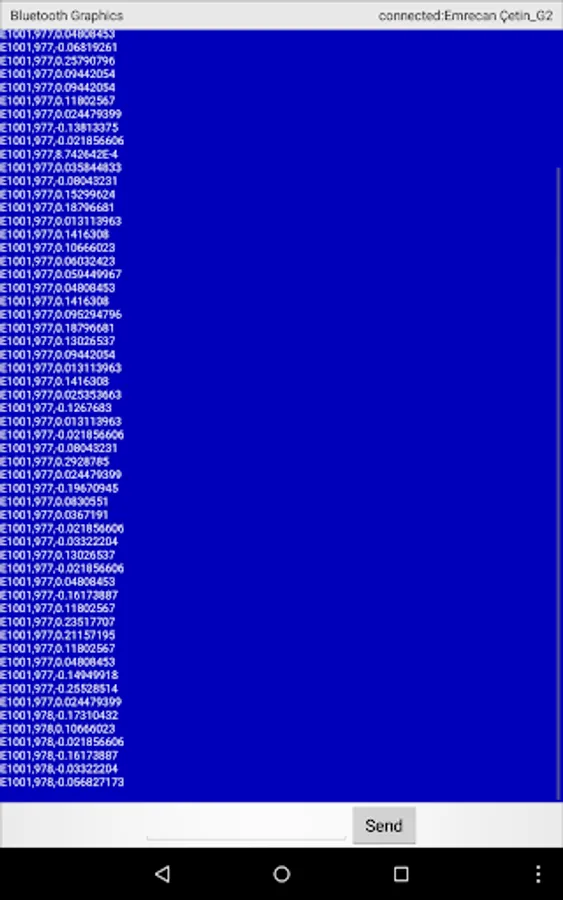
This values must be sent in a sequence.
This sequence must be like that: Evalue1,value2,value3...n
For example: "E256,-321,982n" or "E902,1235,10,23,-325,-1240,90n" etc.
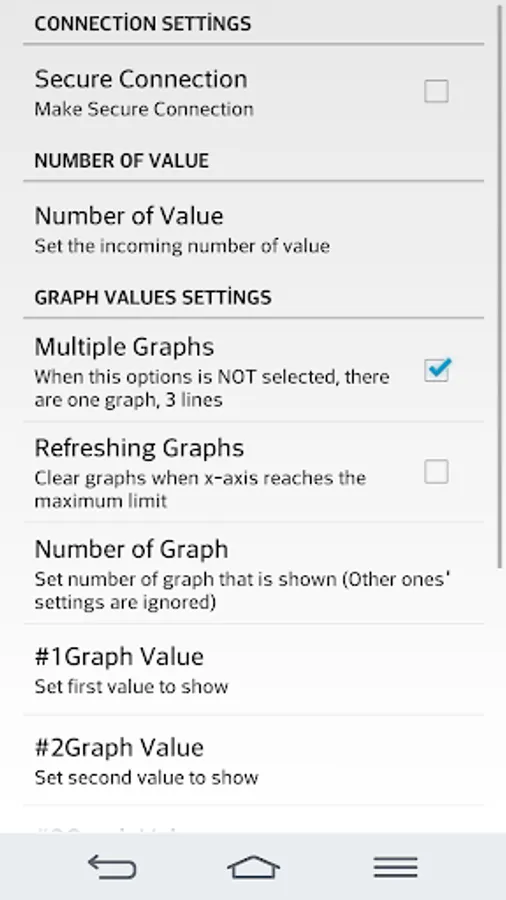
*Data separator is customizable
*This application supports up to 7 variables.
*You can set graphics' maximum and minimum values.
*Autoscaled graphs.
*Values are ordered in the order of sending in application.
*Each graph can show a value that is selected.
*You can set number of graphics that is shown.
*Multiple lines can be shown in a graph.
*Pinch to zoom both axes in graphs.
*Sliding and refreshing graphs.
*Data logs can be saved at *ExternalStorage*/BluetoothGraphics/log*count* directory
MPAndroidChart library is used.
Also there is a serial monitor in it.
You can use this app with arduino or another microcontroller for your robotics projects and etc.
You can see real time 7 graphics of some values.
This values must be sent in a sequence.
This sequence must be like that: Evalue1,value2,value3...n
For example: "E256,-321,982n" or "E902,1235,10,23,-325,-1240,90n" etc.
*Data separator is customizable
*This application supports up to 7 variables.
*You can set graphics' maximum and minimum values.
*Autoscaled graphs.
*Values are ordered in the order of sending in application.
*Each graph can show a value that is selected.
*You can set number of graphics that is shown.
*Multiple lines can be shown in a graph.
*Pinch to zoom both axes in graphs.
*Sliding and refreshing graphs.
*Data logs can be saved at *ExternalStorage*/BluetoothGraphics/log*count* directory
MPAndroidChart library is used.