かるほく icon

かるほく

株式会社フェイバーエンジニアリング
Free
100+ downloads

About かるほく

Karuhoku is an app that visualizes aggregated data / information on garden crop cultivation and can be shared among users.


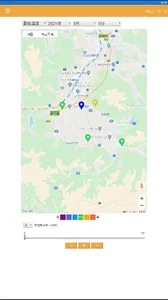
-You can check the numerical data of the meteorological data of the main observation point in real time (updated every 10 minutes).


-You can compare / check the garden temperature measured by the temperature logger on the map.
・ You can check the data by tapping the mark on the map.
* About the color display of the mark
Color visualization of the characteristics of each garden temperature compared to the average (lowest, highest, average, integrated) temperature.

[How to use]
-Select the data you want to check (highest / average / lowest / total).
・ Determine the year
・ Set a date
・ Determine the display period (day / week / month) at the bottom
・ Move the slider to check the temperature change during the display period.
[Display] Day / hour every week / day every month / day


-You can compare / check the garden temperature measured by the temperature logger in a graph.
Garden temperature comparison: You can compare and display each garden temperature.
Garden year comparison: You can compare and display the temperature of each garden for each year.

[How to use]
-Select the data you want to check (highest / average / lowest / total).
・ Determine the period (day / week / month) you want to display on the graph
・ Determine the year (select multiple items for year comparison)
・ Determine the first date to be displayed on the graph
・ Select the garden / district you want to display (multiple)

* The app name of "Karuhoku" is derived from "Cultivation of Horticulture Crops" and "Akarui Tohoku".

かるほく Screenshots