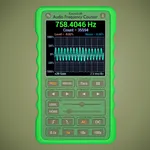
Use this spectrum analyser app to visualize microphone audio through frequency divisions, peak detection, and customizable display options. Includes saving CSV data, auto-scaling, octave bands, peak cursors, and weighting filters.
AppRecs review analysis
AppRecs rating 4.3. Trustworthiness 0 out of 100. Review manipulation risk 0 out of 100. Based on a review sample analyzed.
★★★★☆
4.3
AppRecs Rating
Ratings breakdown
5 star
71%
4 star
13%
3 star
4%
2 star
0%
1 star
12%
What to know
✓
High user satisfaction
84% of sampled ratings are 4+ stars (4.3★ average)
✓
Authentic reviews
Natural distribution, no red flags
About Spectrum Analyser
Audio spectrum analyser for your microphone.
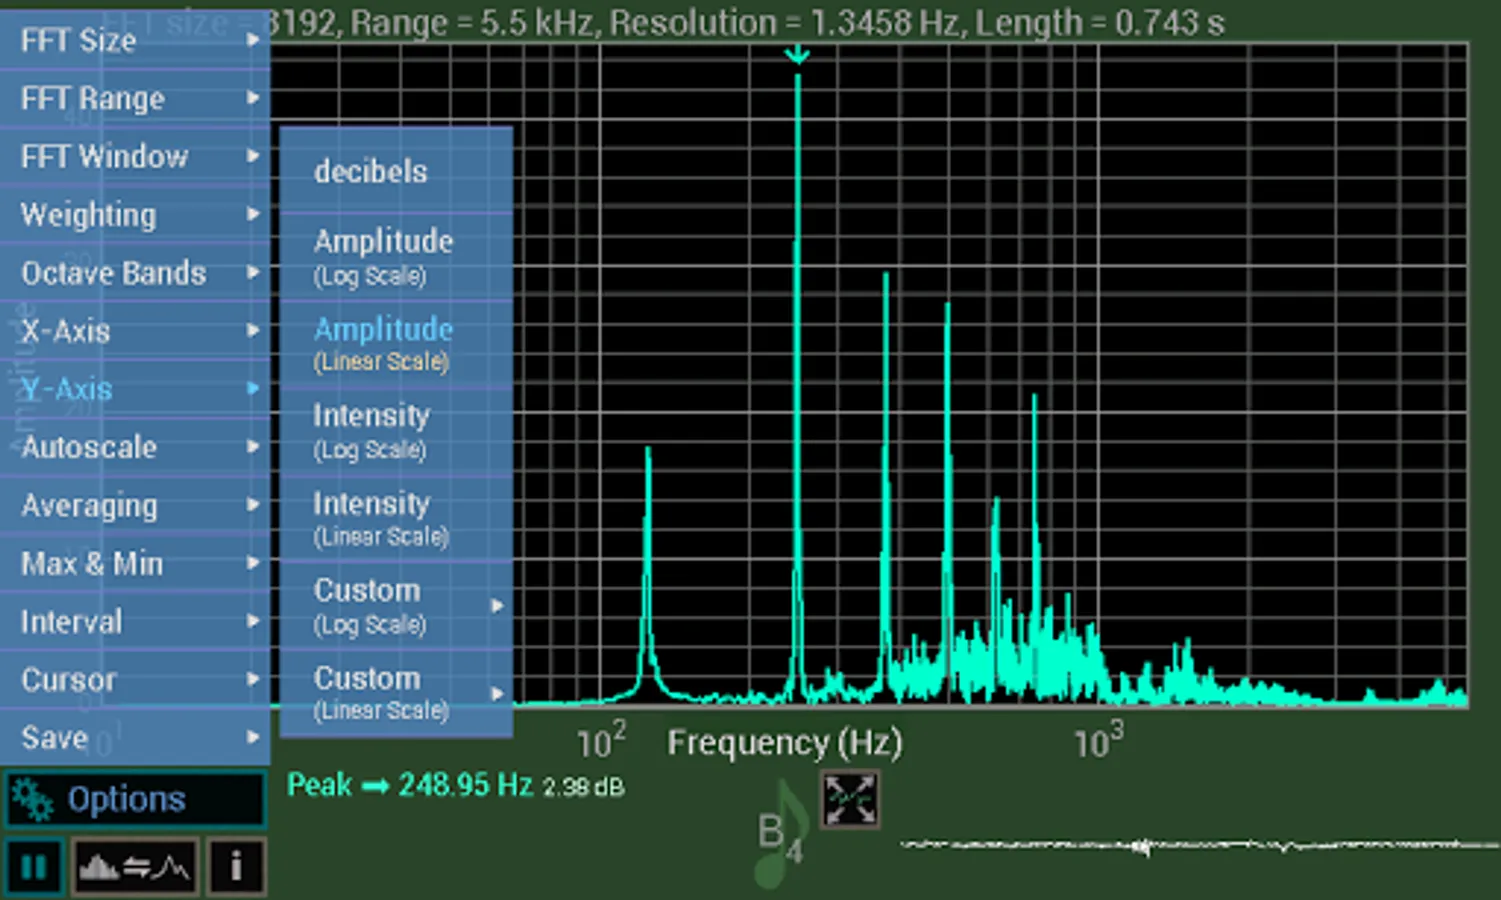
64 up to 8192 frequency divisions (128 to 16384 FFT size).
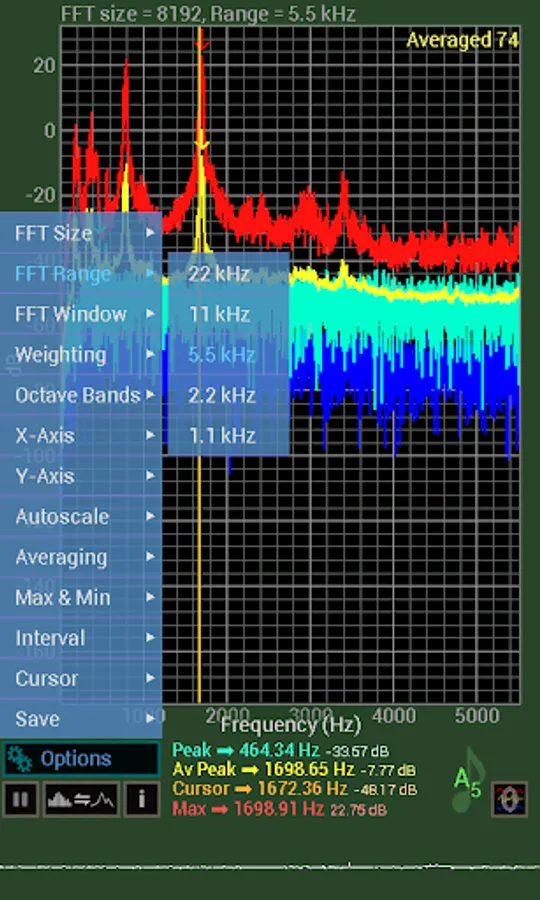
22 kHz spectrum range (can reduce down to 1 kHz for higher resolution).
FFT Windowing (Bartlett, Blackman, Flat Top, Hanning, Hamming, Tukey, Welch, or none)
Auto-scale or pinch to zoom, drag to pan.
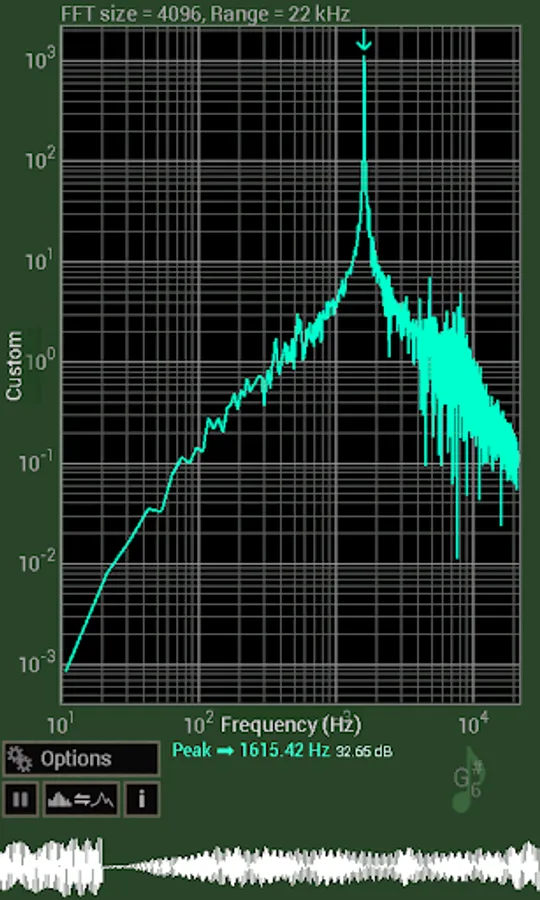
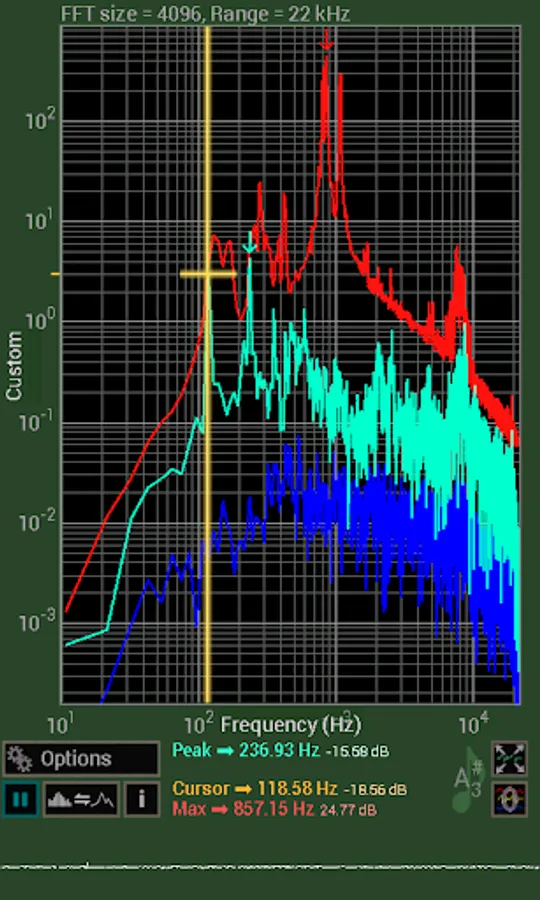
Linear or logarithmic scales.
Peak frequency detection (polynomial fit).
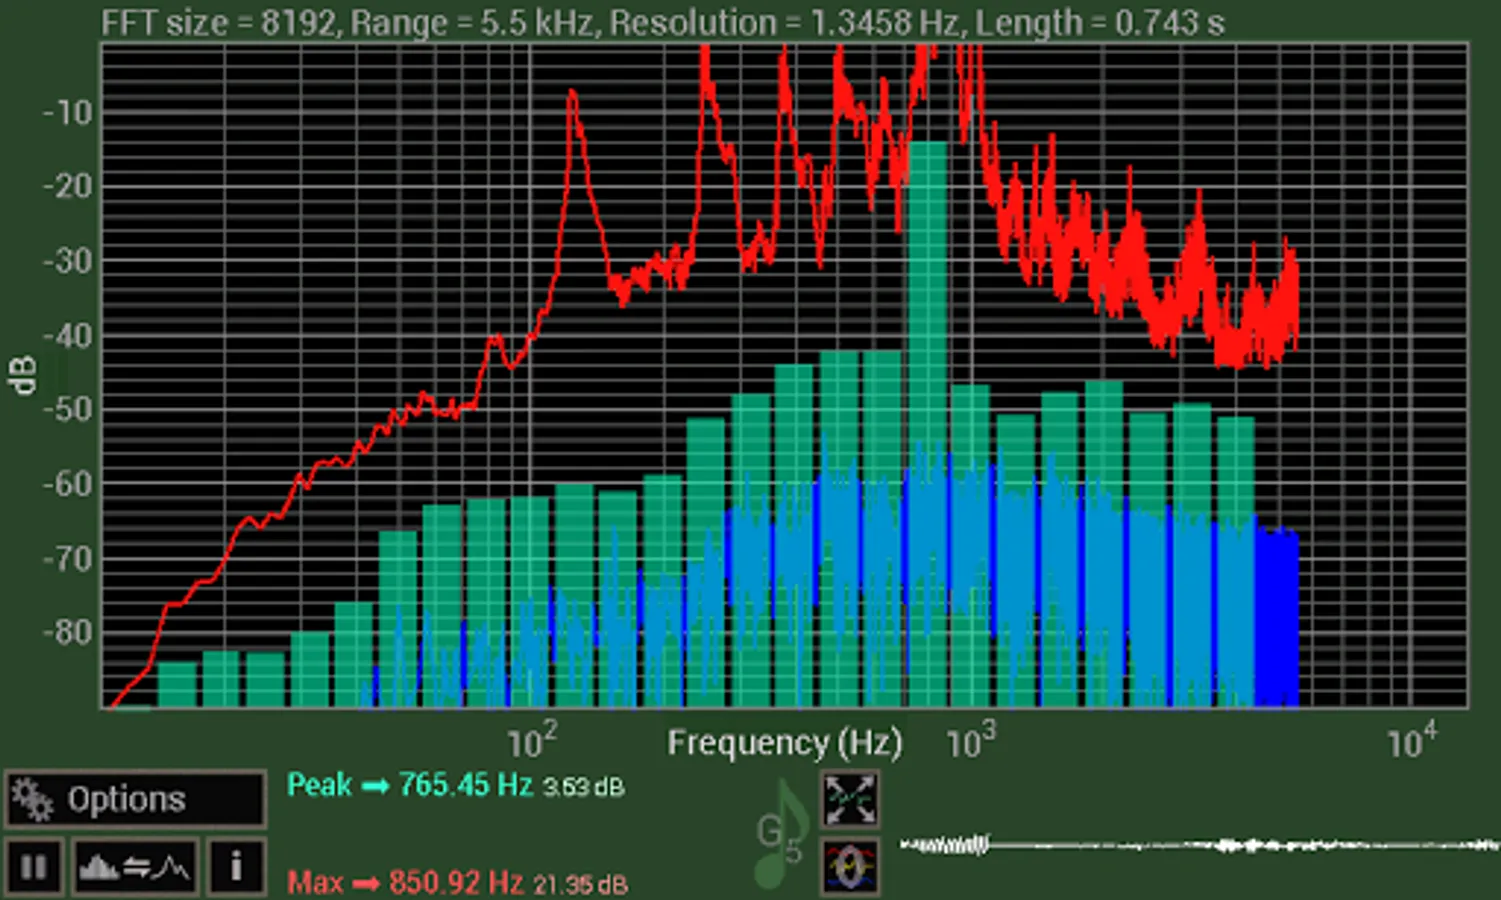
Averaging, Min and Max.
Save CSV data files (uses Write External Storage Permission).
Free or snap to peak cursor.
Octave Bands - Full, half, third, sixth, ninth or twelfth bands.
Weighting – A, C or None (A weighting filters the high and low frequencies according to how the ear perceives sound loudness).
Musical note indicator (green if within 5 cents, orange if within 10 cents).
Auto-scaling microphone input trace.
For best response on slower devices, keep the FFT size low.
More detailed explanation available on website
64 up to 8192 frequency divisions (128 to 16384 FFT size).
22 kHz spectrum range (can reduce down to 1 kHz for higher resolution).
FFT Windowing (Bartlett, Blackman, Flat Top, Hanning, Hamming, Tukey, Welch, or none)
Auto-scale or pinch to zoom, drag to pan.
Linear or logarithmic scales.
Peak frequency detection (polynomial fit).
Averaging, Min and Max.
Save CSV data files (uses Write External Storage Permission).
Free or snap to peak cursor.
Octave Bands - Full, half, third, sixth, ninth or twelfth bands.
Weighting – A, C or None (A weighting filters the high and low frequencies according to how the ear perceives sound loudness).
Musical note indicator (green if within 5 cents, orange if within 10 cents).
Auto-scaling microphone input trace.
For best response on slower devices, keep the FFT size low.
More detailed explanation available on website
Spectrum Analyser Screenshots
Tap to Rate: