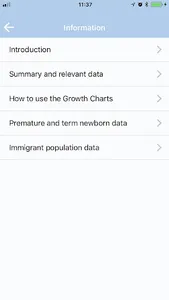
Record unlimited dates, weights and lengths or sizes of their children, and see the representation of your data (entered and calculated) over time under five different graphics modes, each with seven lines of percentiles or type z-scores deviations (SDS) smoothed:
• Length - height for age
• Weight for age
• Growth rate for age
• Body mass index (BMI) for age
• Index tri-weight mass (IMT) for age
In addition, height, weight and growth rate calculated have six different groups of graphs, by age of onset of pubertal growth spurt: one representing the entire population and one for each of the five rhythms ripening (from very early until very late). BMI and IMT are calculated and represent a unique group of graphs representing the entire population (no significant differences between groups pubertal ripeners).
Learn how to use growth charts and how are standards studies and longitudinal growth of Barcelona 1995-2017, which represents a population of this new millennium.
Show More


