About Cluster2A
For most people, it is difficult to obtain the information they need directly from raw data. Machine learning can transform disordered data into useful information. Clustering is an unsupervised machine learning technique that groups similar objects into the same cluster. Cluster2A combines the two most popular clustering algorithms, K-means and DBSCAN, to help you discover interesting patterns in the data.
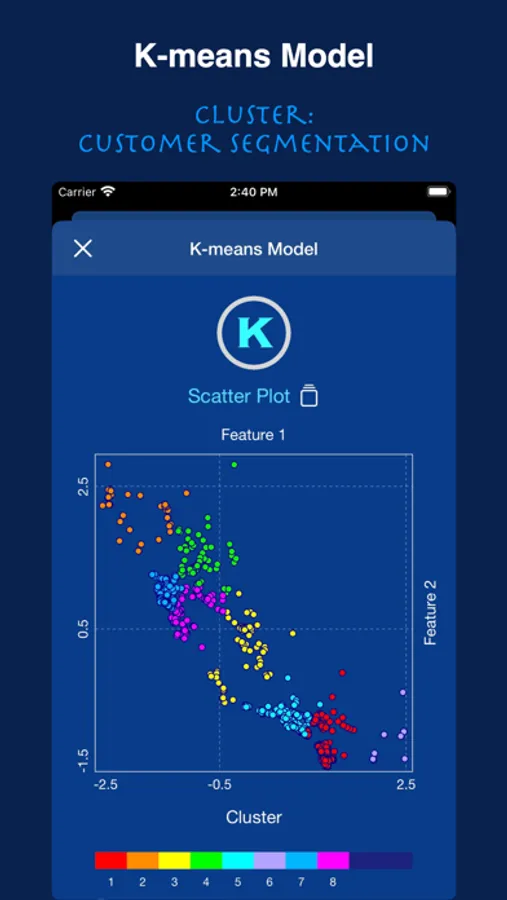
For example, Cluster2A can perform cluster analysis based on customer consumption behavior and provide results for customer segmentation. Customer segmentation is the use of specific characteristics to identify and organize customers. These characteristics can be demographic, behavioral/psychological characteristics and geographic location. Customer segmentation can identify customers and provide products and services tailored to their needs. This personalization will provide you with a competitive advantage, increase customer conversion rates and brand loyalty.
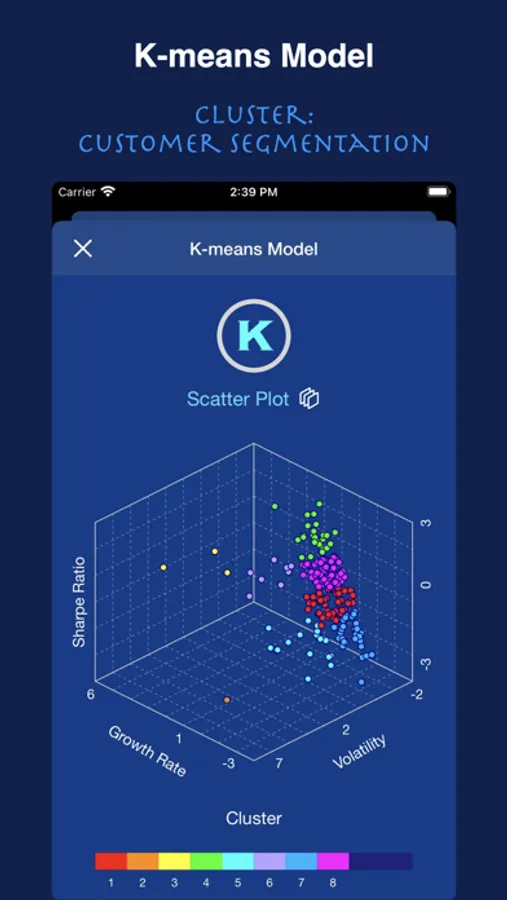
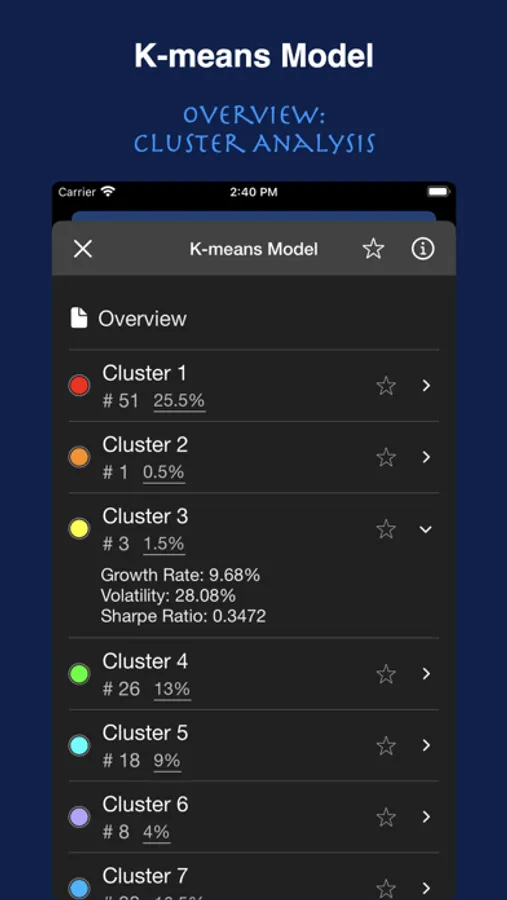
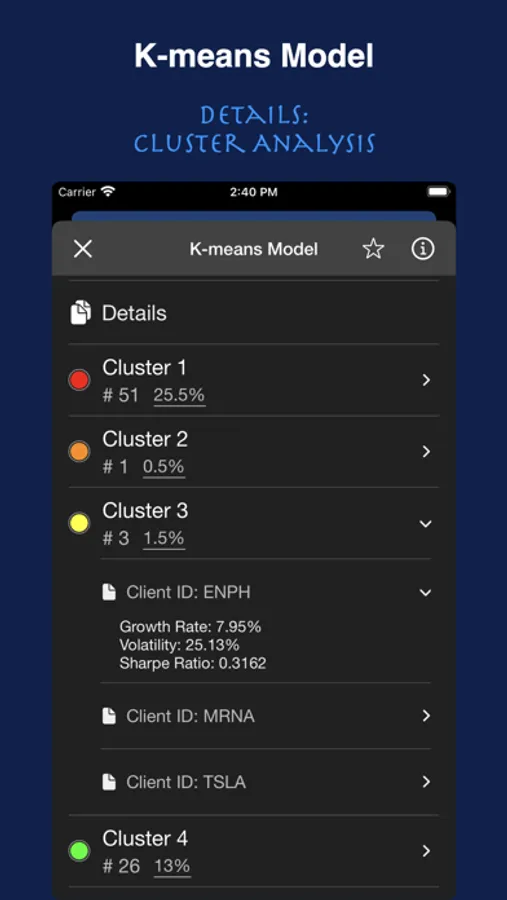
K-means Model:
The K-means algorithm requires the number of clusters to be specified. The main goal is to find a representative data point (called centroid) in a large amount of high-dimensional data, and then assign each data point to the nearest centroid.
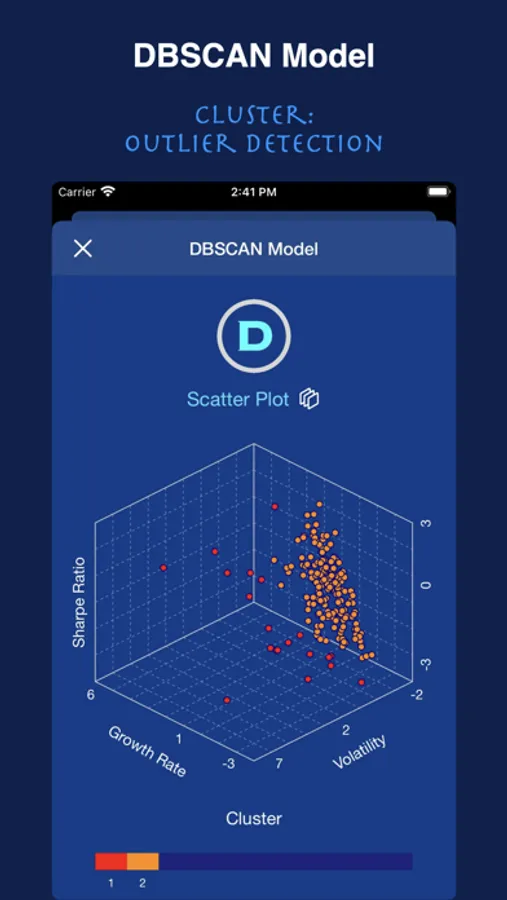
DBSCAN Model:
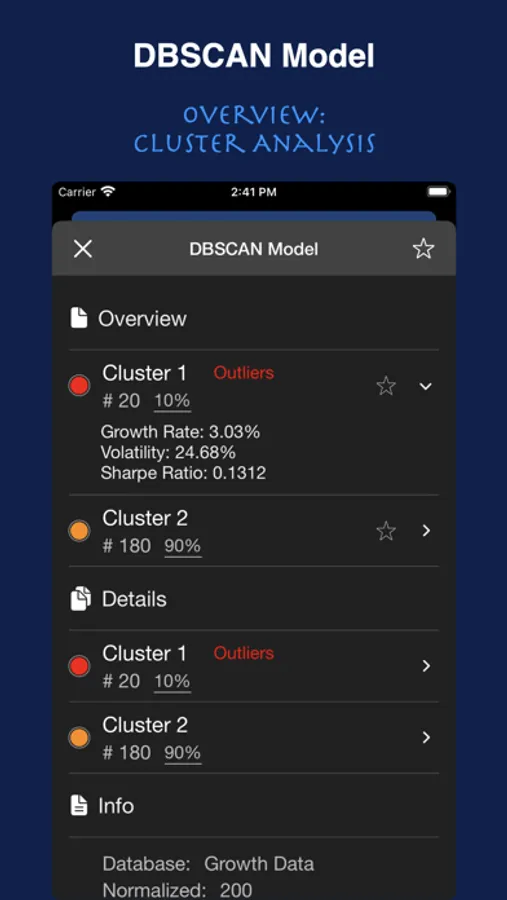
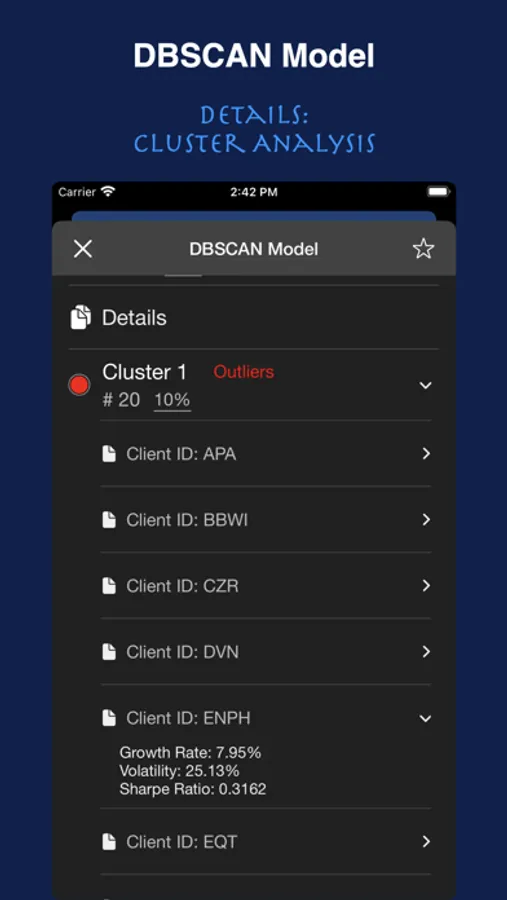
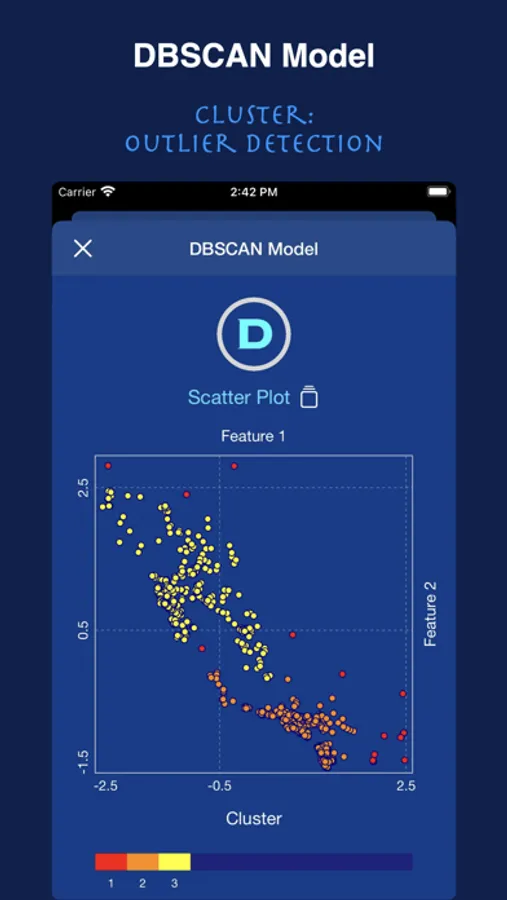
Unlike K-means, DBSCAN does not need to specify the number of clusters to be generated. The DBSCAN algorithm processes data points based on density, mainly dividing sufficiently dense points in the feature space into the same cluster, and can identify outliers that do not belong to any cluster, which is very suitable for detecting outliers.
Growth data type:
You can select time series data with 12 periods, 24 periods, and 36 periods for analysis.
The most commonly used data are monthly material purchase prices, monthly product sales, monthly customer purchases, and the company's annual operating income.
For example, you can perform cluster analysis based on the monthly purchase data of VIP customers. Cluster2A will automatically calculate each customer's purchase growth rate, purchase volatility and the growth rate per unit of volatility, and make clustering recommendations.
Feature data type:
You can select 2 to 10 characteristics for analysis.
The most commonly used characteristics are as follows: Demographics: For example, age, gender, income, education, nationality and family size. Behavior/Psychology: For example, consumption style (RFM model) and personality type (DISC model). Geography: For example, country, region and city. Statistics/Finance: For example, mean, standard deviation, Sharpe ratio, β, α and R-squared.
For example, you can perform cluster analysis based on the three buying characteristics of customers, RFM (Recency, Frequency, Monetary).
