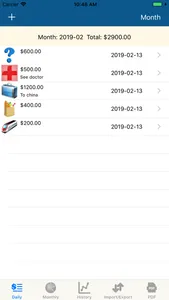
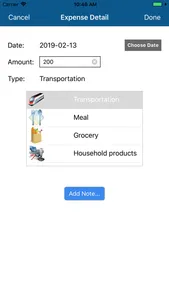
It helps people record daily spending.
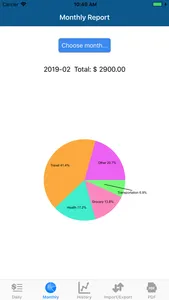
Piechart is used to display the proportion of each type of spending in each month.
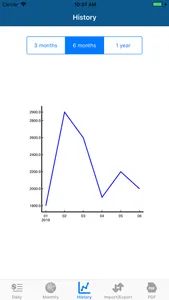
Total expenditure in the past 3 ~ 12 months are shown in trendy chart.
It also has import and export data function. Old data can be moved to new device using this function.
All data in the past 6 months can be summarised in pdf.
Show More


