About BETACHEK
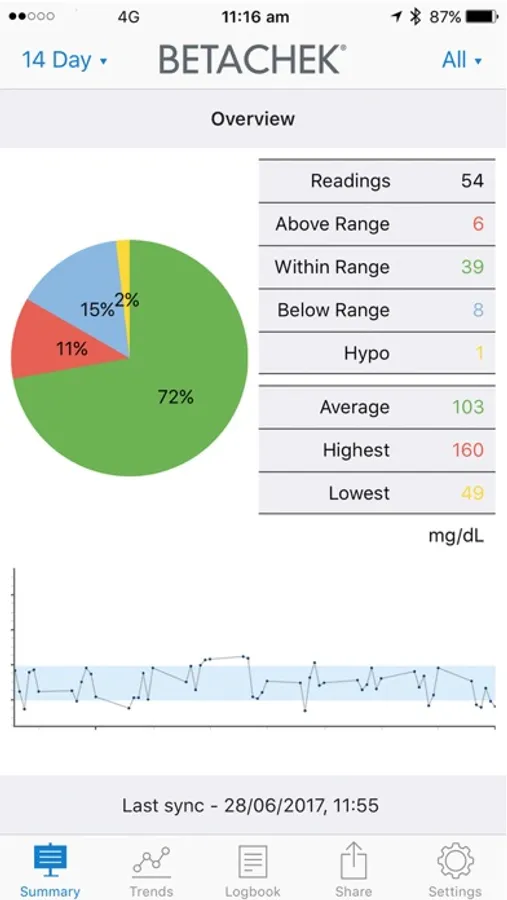
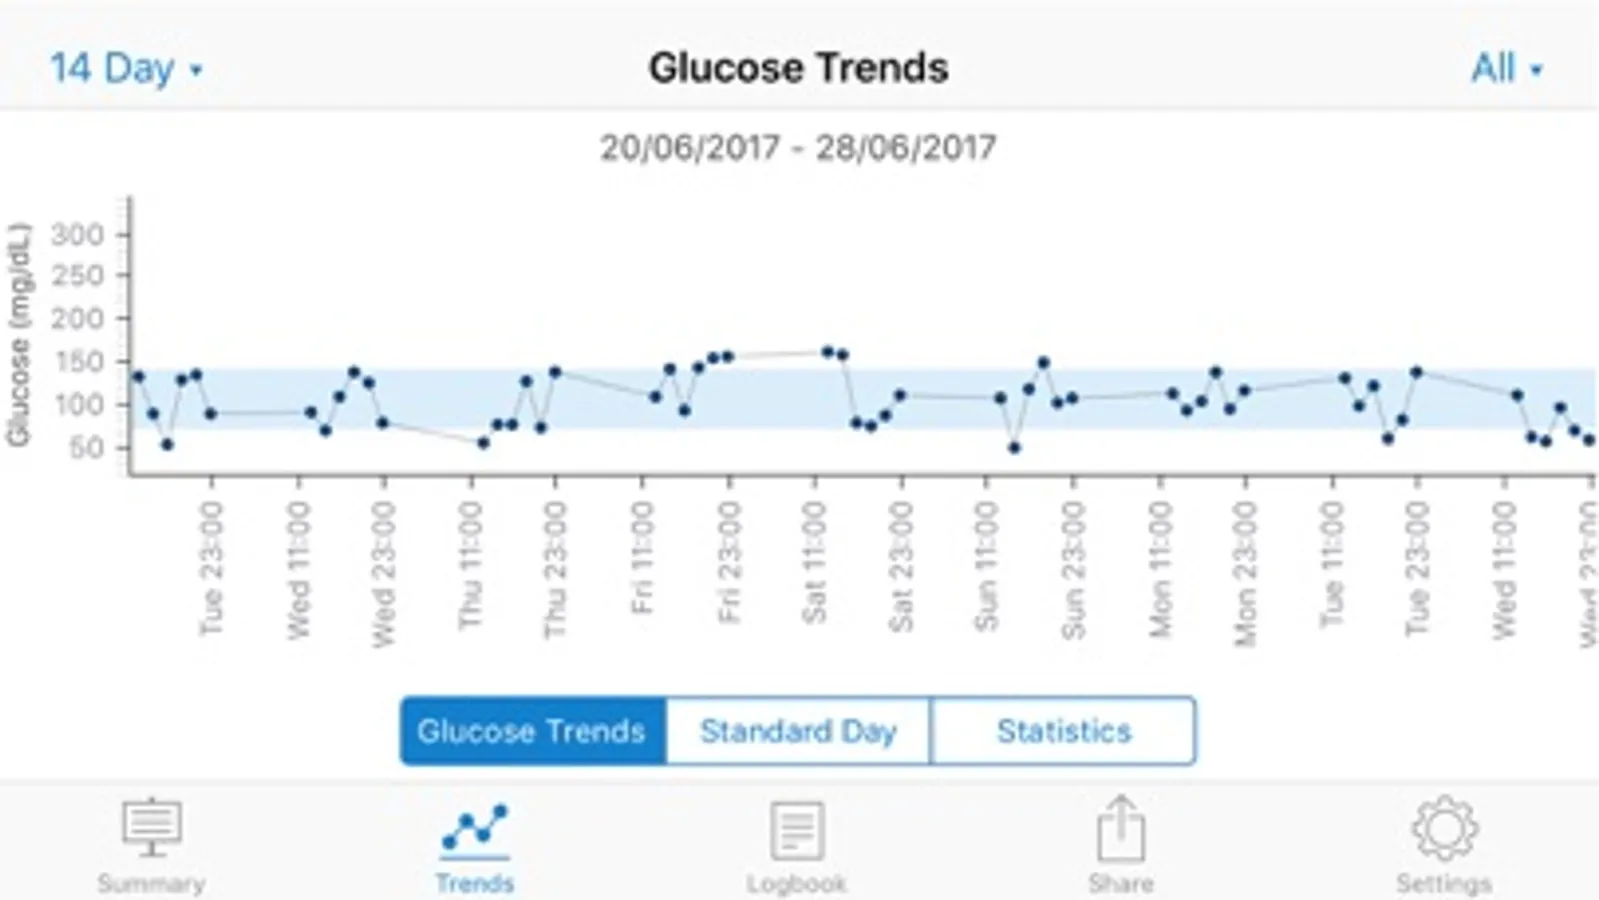
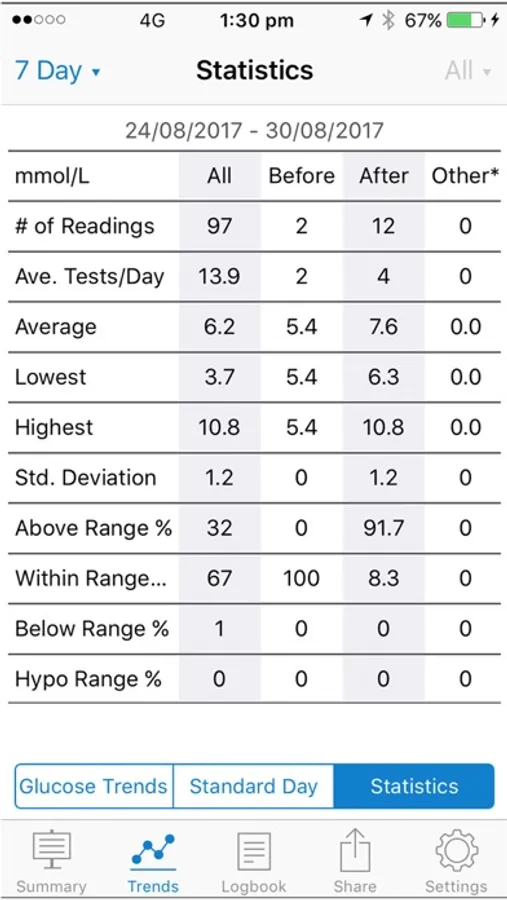
The Betachek Diabetes Management App automatically uploads test results from your Betachek C50 meter and then graphs and analyses them:
- Average number of tests per day (all, before meals, after meals)
- Average test value (all, before meals, after meals)
- Lowest reading (all, before meals, after meals)
- Highest reading (all, before meals, after meals)
- Std Deviation
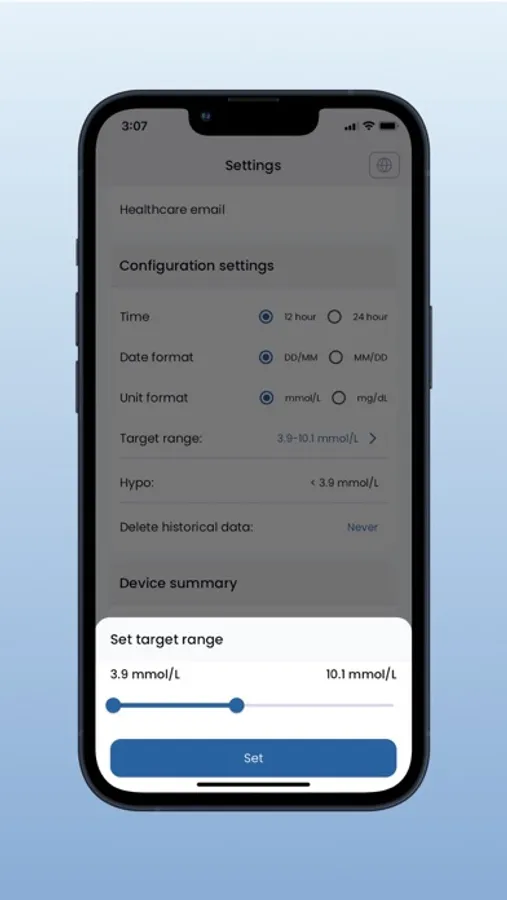
- Above target range (all, before meals, after meals)
- Within target range (all, before meals, after meals)
- Below target range (all, before meals, after meals)
- Below range %
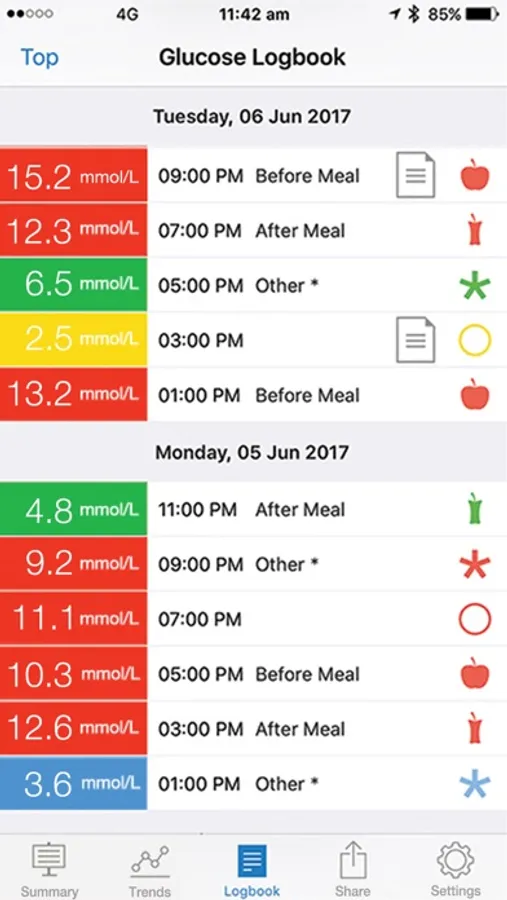
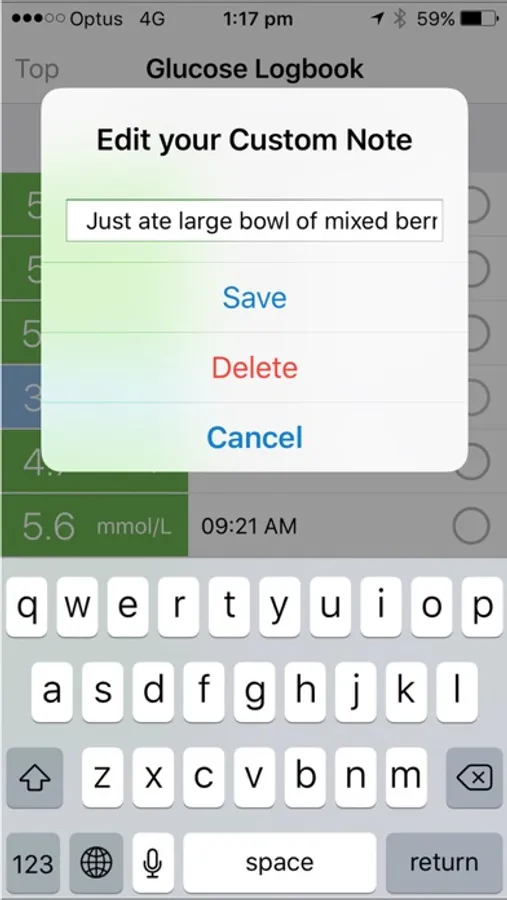
- Add descriptions to any result or attach an icon.
- Export reports as a PDF file:
Exporting a glucose report allows you to share information with your healthcare professional and others to get the support needed to better manage your diabetes.
The glucose report includes key summaries, trend graphs and statistics for the last 7, 14, 30 or 90 days (filter).
A logbook of all results with time, date and descriptions enables you to analyse information in other programs such as Microsoft Excel.
