About MCT Live!
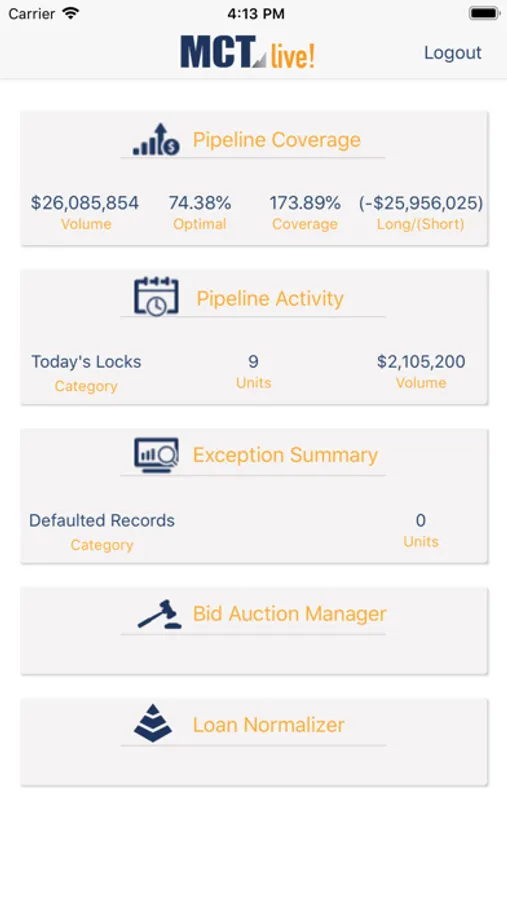
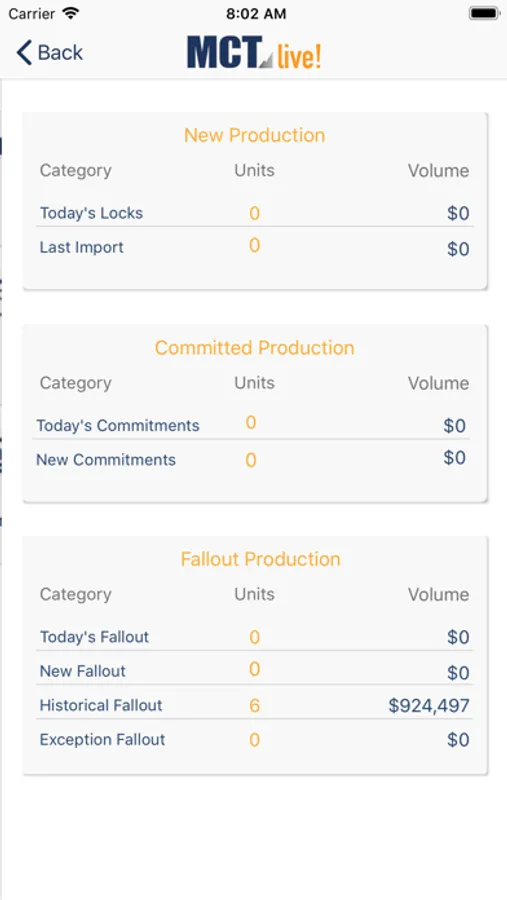
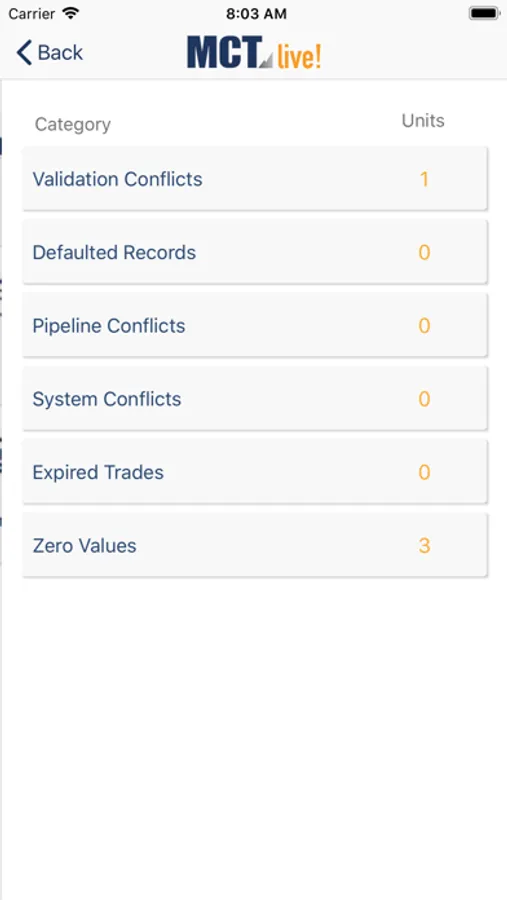
Get continuous real time pipeline coverage analysis using the MCT Live! application.
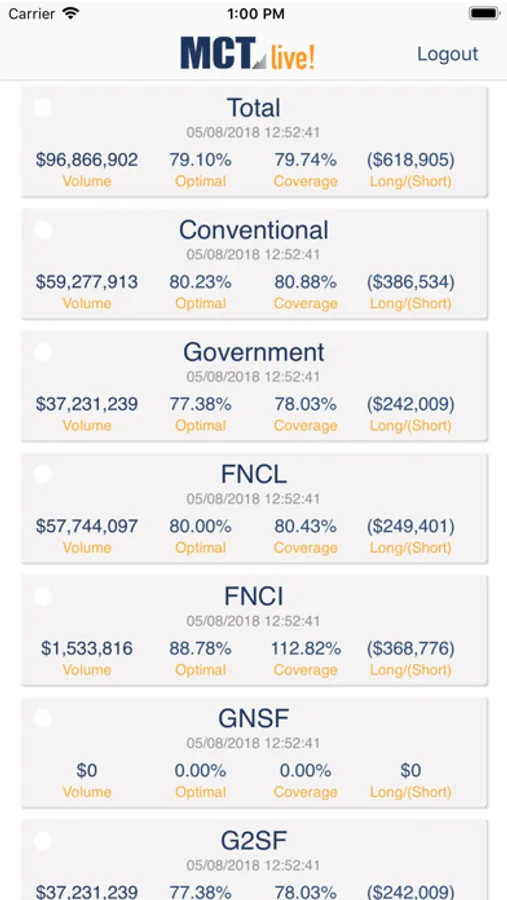
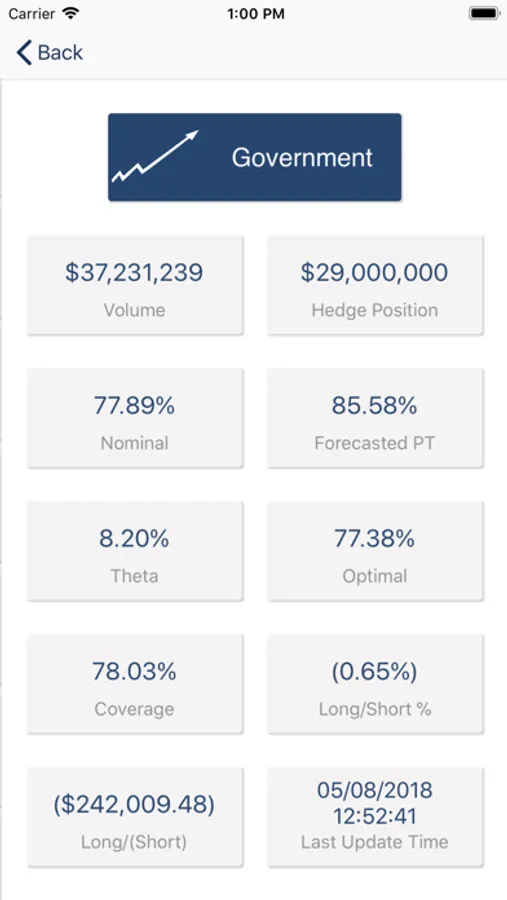
Key figures included: Pipeline Volume, Weighted Average Forecasted Pull Through, Duration Adjusted Coverage and Long/Short Exposure.
The timestamp of the last LOS pipeline data update is also provided.
Key figures included: Pipeline Volume, Weighted Average Forecasted Pull Through, Duration Adjusted Coverage and Long/Short Exposure.
The timestamp of the last LOS pipeline data update is also provided.
