About NTN PORTABLE VIBROSCOPE
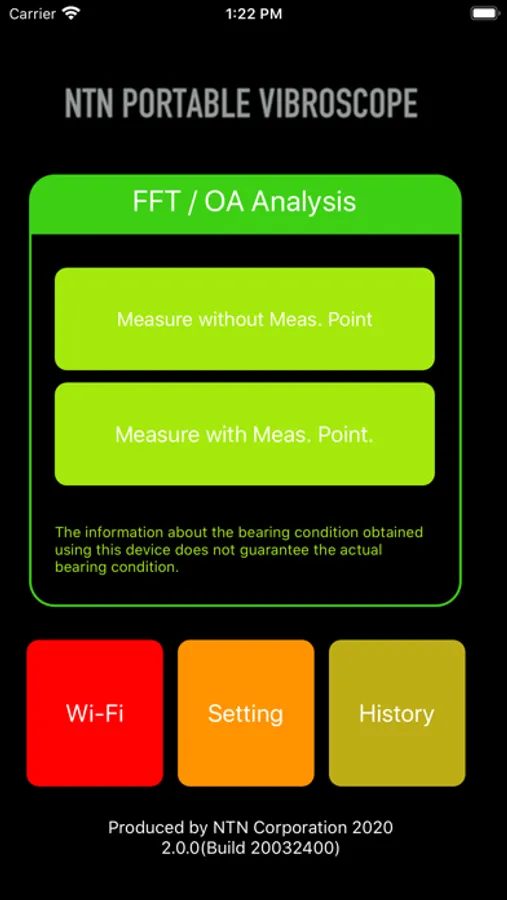
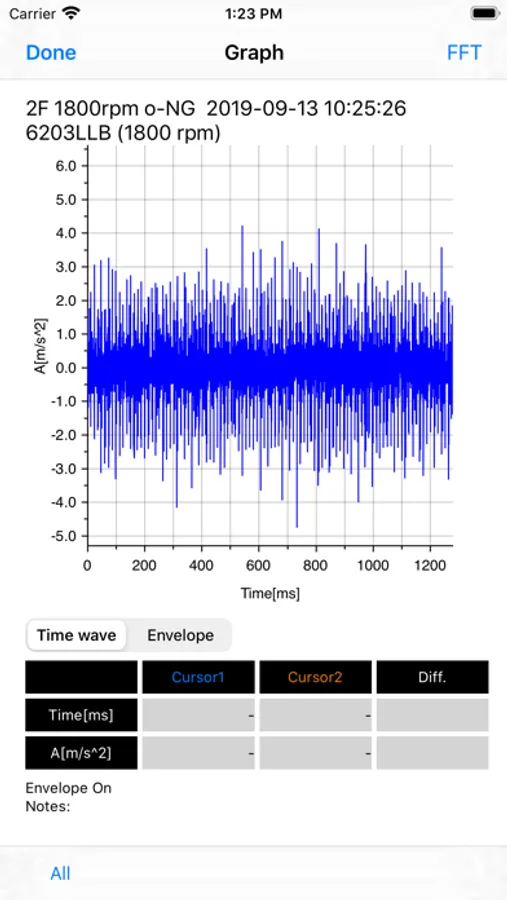
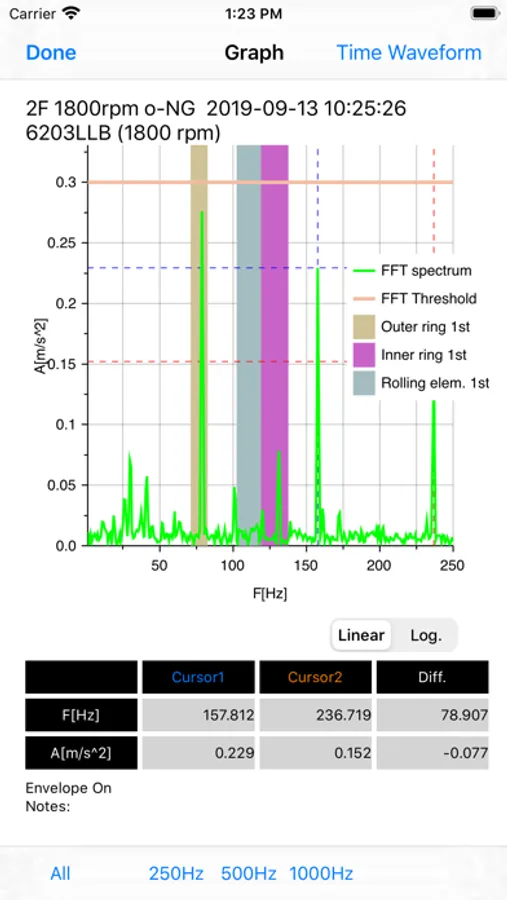
This App can analyze the vibration of equipment through acceleration data received wirelessly, and perform OA and FFT analysis, and displays the analysis result on the tablet screen.
The Bearing damage can be identified using the bearing frequencies estimated from the FFT analysis. Bearing replacement recommendations can be managed by entering threshold values for the bearing vibration levels.
In OA analysis, normal or abnormal results can be displayed by setting threshold values for acceleration, velocity, and displacement.
In addition, equipment / component condition is judged based on ISO 10816 vibration evaluation criteria.
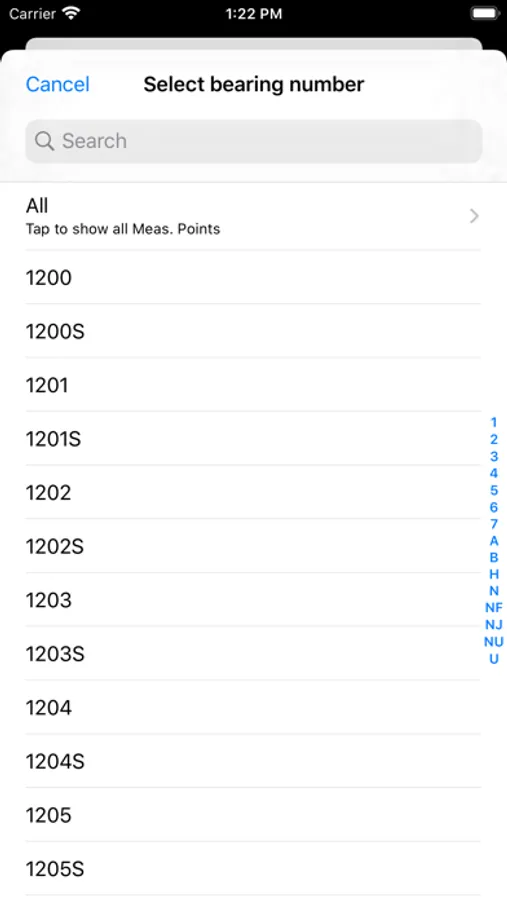
You can select NTN bearings from the preset bearing list registered in the app, and create multiple measurement points with the preset rotational speed and thresholds.
For non-NTN bearings, you can create an original bearing list by entering the bearing internal specifications or bearing vibration frequencies.
Data storage and history management are available, and the change over time of vibration measurement results can be viewed in a line graph.
Data that can be managed in history is OA, FFT, and time waveform.
Saved measurement data can be imported from a tablet to a user’s computer and edited with a spreadsheet.


