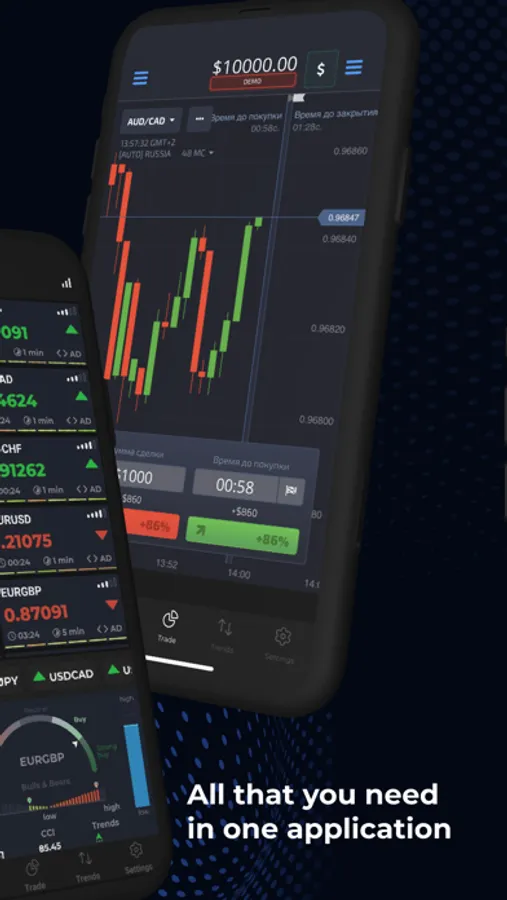
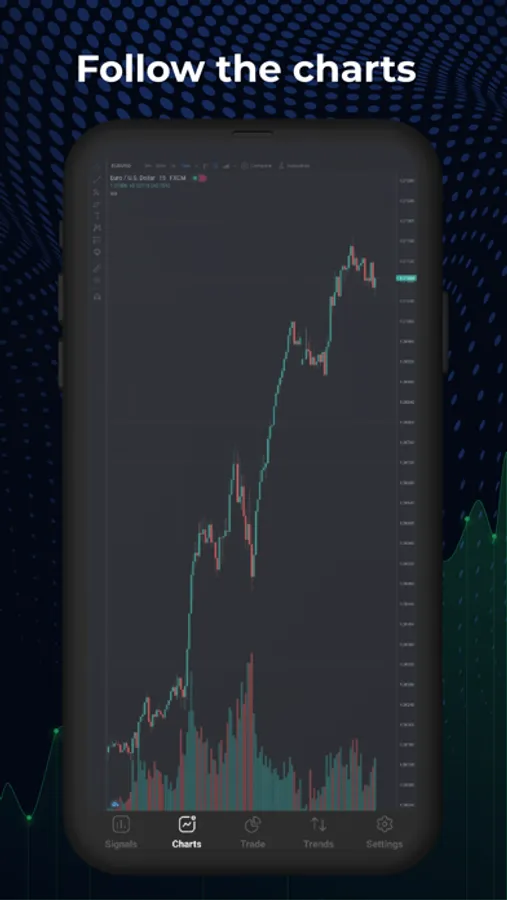
In this trading app, users analyze signals and indicators to make informed options trades. Includes market sentiment data, signal power analysis, and multiple technical indicators.
About vfxAlert
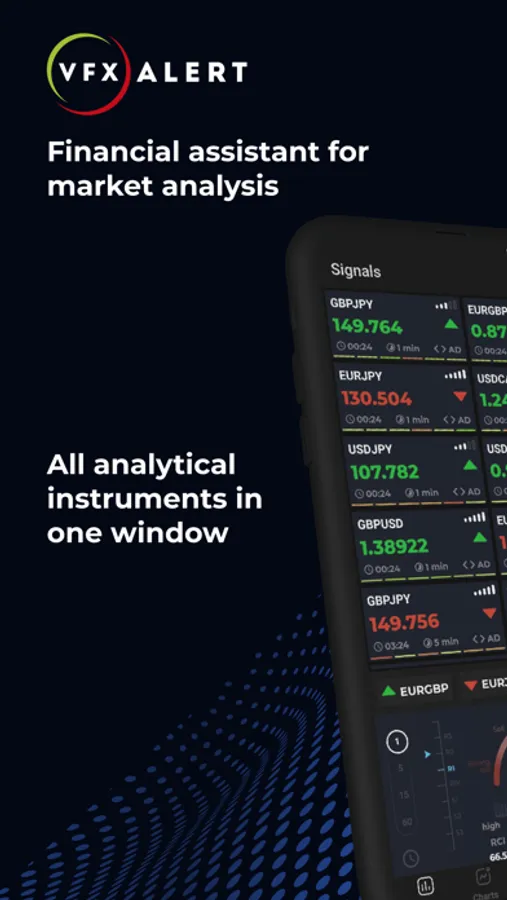
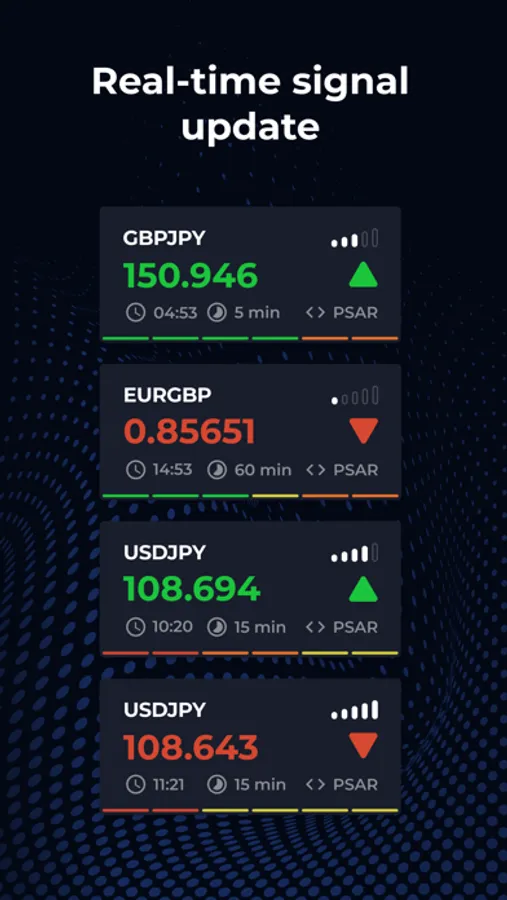
Signal structure:
Trading asset. The trading asset for which the trading signal vfxAlert appeared.
Price. Quote when signal appeared.
Time. Time since the appearance of the signal.
Expiration. Recommended time of the option’s expiration.
Algorithm. Signal search algorithm.
Signal. Type of the option — CALL (buy)/PUT (sell).
Power. Signal power. The percentage of profitable options according to the current indicator’s data. The signal power shows the data for the one trading asset in one timeframe.
Heatmap. Heatmaps. The power of the current trend or reversal. It is defined according to the statistics and indicators for the current timeframe. It shows the date for the Price during one timeframe.
Additional indicators:
- The Volatility indicator shows the current market activity — the higher it is, the greater the likelihood of frequent price reversals.
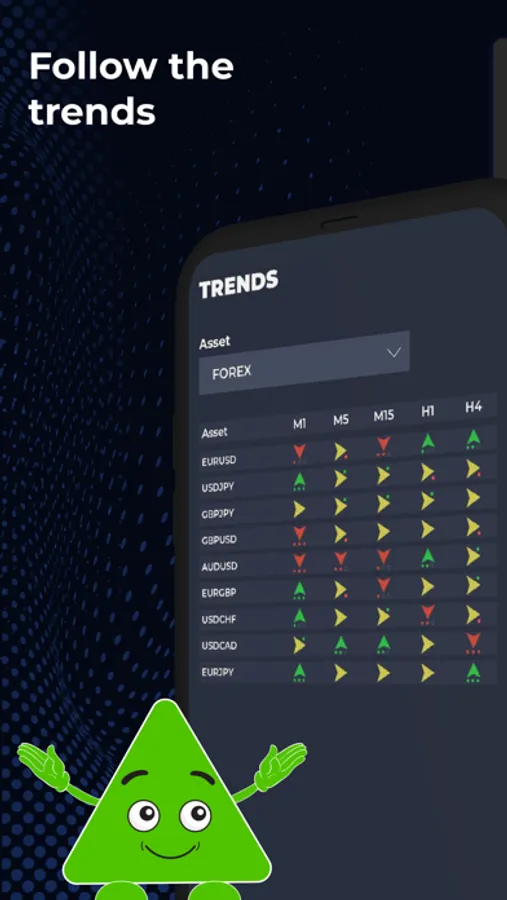
- The Trends indicator shows where the market can move during the next 101-5 bars of the selected timeframe.
- Commodity Channel Index CCI shows the dynamics of price movement or how fast the current trend is growing or ending.
- The colored scale Bulls&Bears represents the calculation of power balance for buyers and sellers.
- The trend indicators RSI define the power of the current trend and the probability of the reversal.
- The pannel Summary shows the information about the current market sentiment in the form of the «heat» scale.
- Pivot Points are the indicators of the reversal points using which the trade can forecast the growth of assets to a certain level.
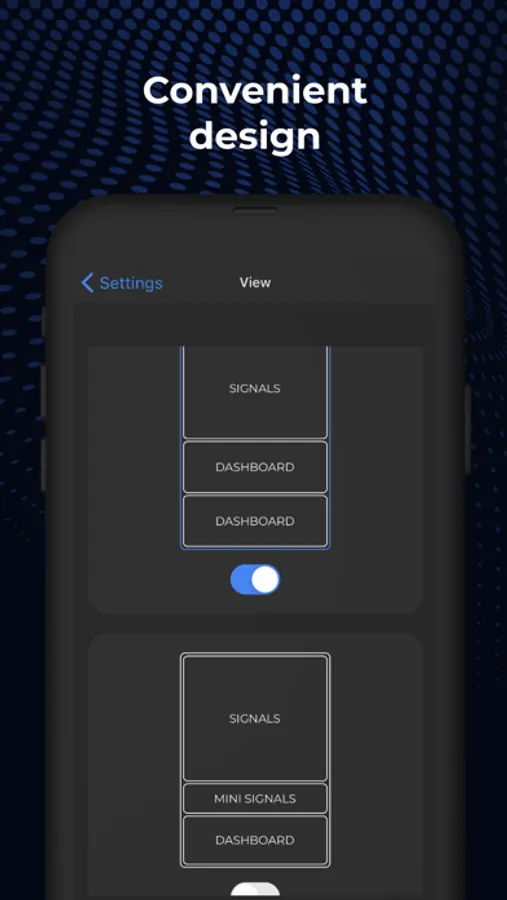
vfxAlert is your universal assistant for trading. The interface is convenient and intuitive. vfxAlert service is available in any place in the world. 24/7 assistance will help you to answer all your questions.
