With this chart-making app, you can create bar and line graphs using your data and export them as images or PDFs. Includes options for various chart types and data entry tools.
AppRecs review analysis
AppRecs rating 3.9. Trustworthiness 68 out of 100. Review manipulation risk 16 out of 100. Based on a review sample analyzed.
★★★☆☆
3.9
AppRecs Rating
Ratings breakdown
5 star
64%
4 star
8%
3 star
6%
2 star
2%
1 star
20%
What to know
✓
Low review manipulation risk
16% review manipulation risk
✓
Good user ratings
72% positive sampled reviews
✓
Authentic reviews
Natural distribution, no red flags
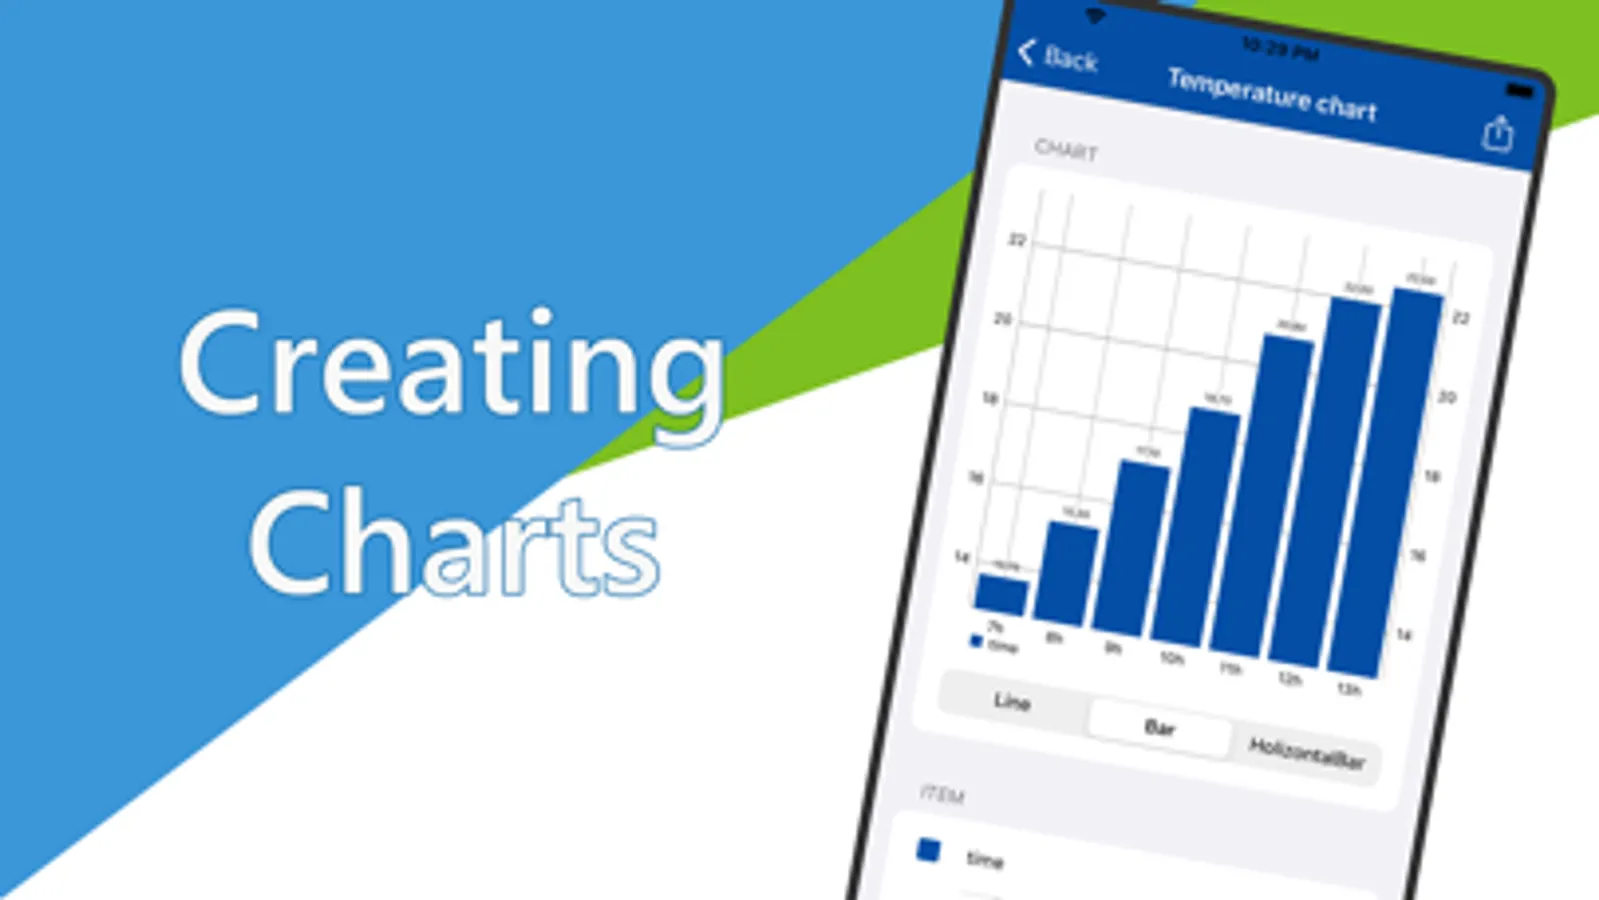
About Chart Maker - Create Charts
It is a tool application that can create bar graphs and line graphs.
The created graph can be output as PDF / image
You can use it freely, such as daily records and graphing store sales.
You can use it like this
・ Daily body temperature record
・ Daily weight record
・ Graph the sales of the store
・ Creation of population transition table
・ Creating graphs to attach to school reports
・ Creation of statistical data
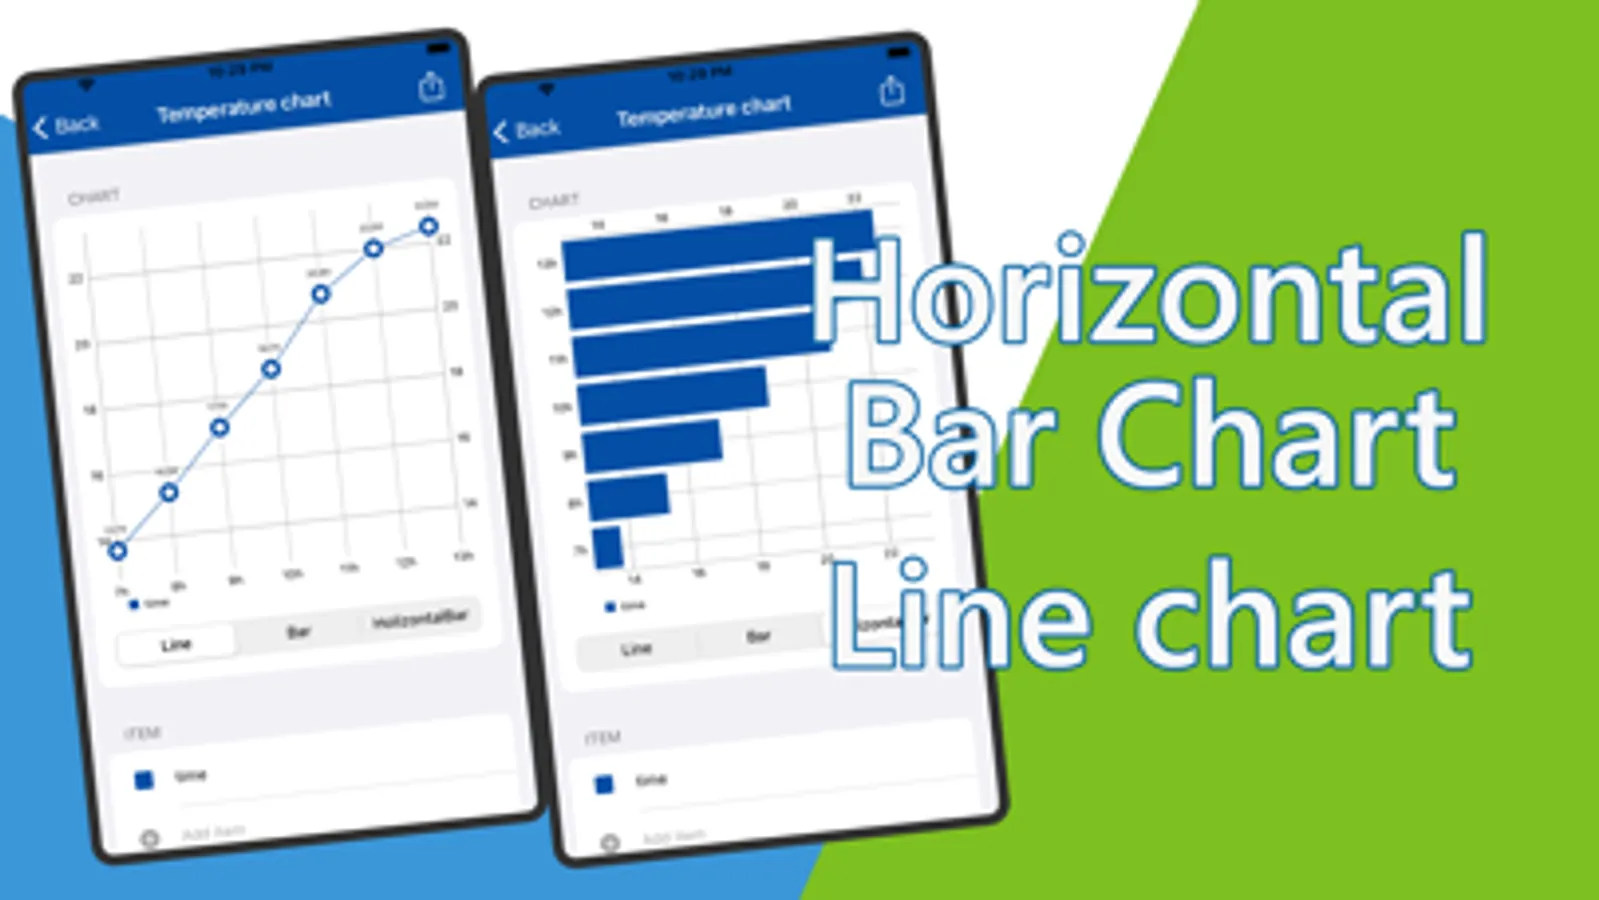
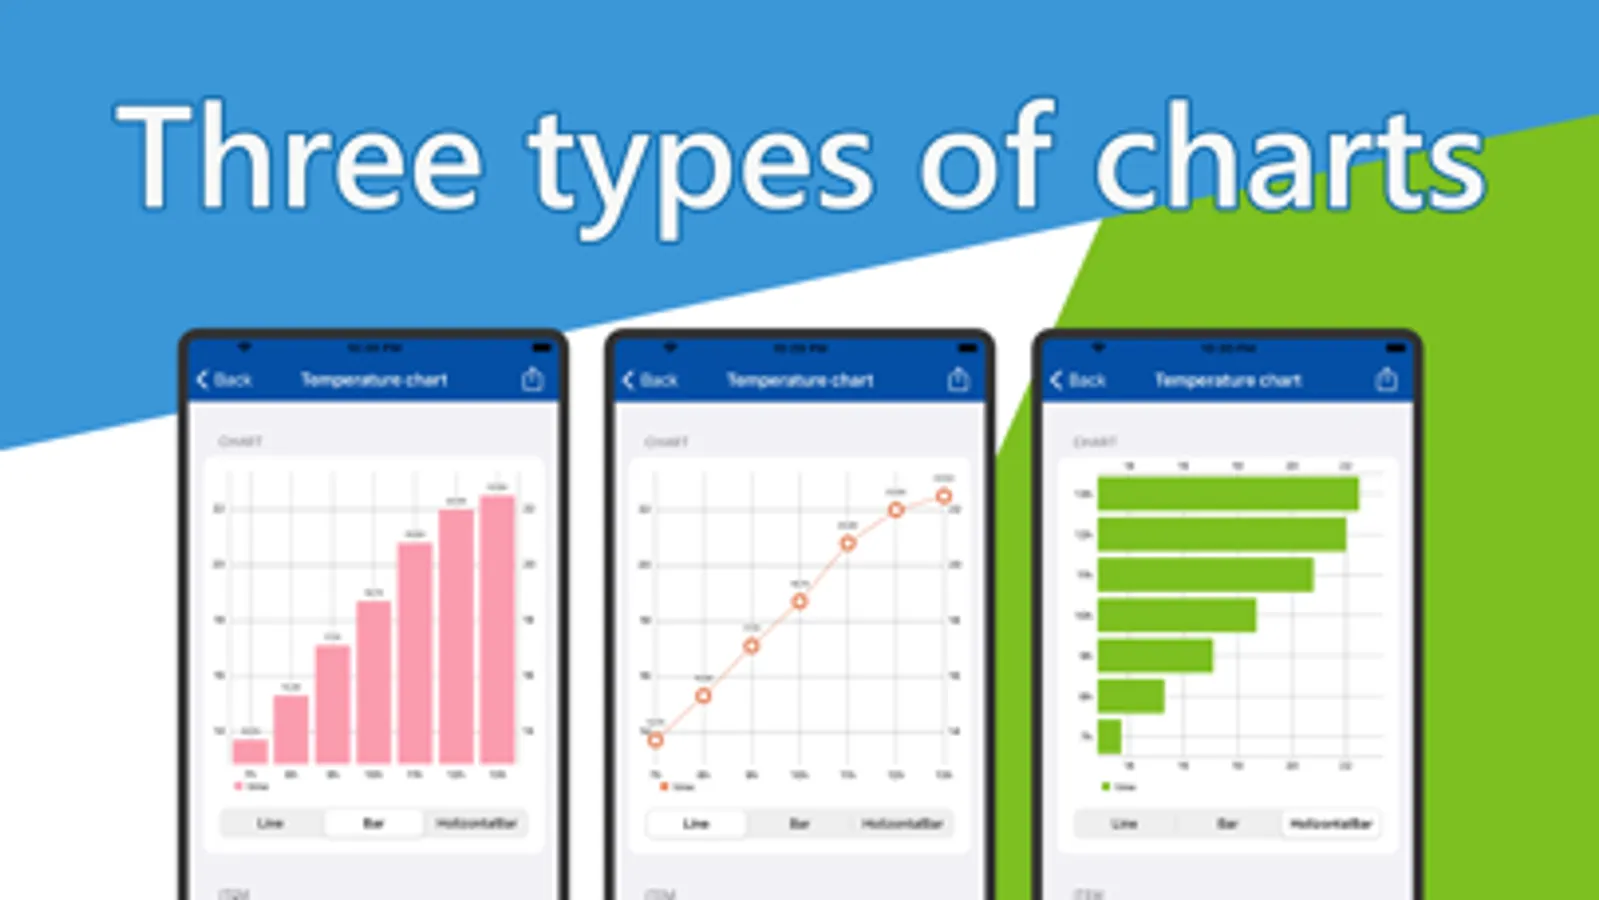
Graph type
・ Line graph
・ bar graph
・ Horizontal bar graph
The created image can be output as PDF or image.
It can also be used to create images and PDFs for materials.
The created graph can be output as PDF / image
You can use it freely, such as daily records and graphing store sales.
You can use it like this
・ Daily body temperature record
・ Daily weight record
・ Graph the sales of the store
・ Creation of population transition table
・ Creating graphs to attach to school reports
・ Creation of statistical data
Graph type
・ Line graph
・ bar graph
・ Horizontal bar graph
The created image can be output as PDF or image.
It can also be used to create images and PDFs for materials.
Chart Maker - Create Charts Screenshots
Tap to Rate:
Reviews for Chart Maker - Create Charts
georgietov
Good but needing some improvement.
It does what I want. A graph . Simple to use but not because of instructions or guidance offered by the app but because I had to spend a while plus patience to figure it out. It would be helpful to have some guidance to start its use.
Seriously bruh why
Stupid.
Dont waste your time buying this, If you do, you'll see…