AppRecs review analysis
AppRecs rating . Trustworthiness 51 out of 100. Review manipulation risk 15 out of 100. Based on a review sample analyzed.
★
AppRecs Rating
Ratings breakdown
5 star
0%
4 star
0%
3 star
0%
2 star
50%
1 star
50%
What to know
⚠
Mixed user feedback
Average 1.5★ rating suggests room for improvement
About Stock Charts
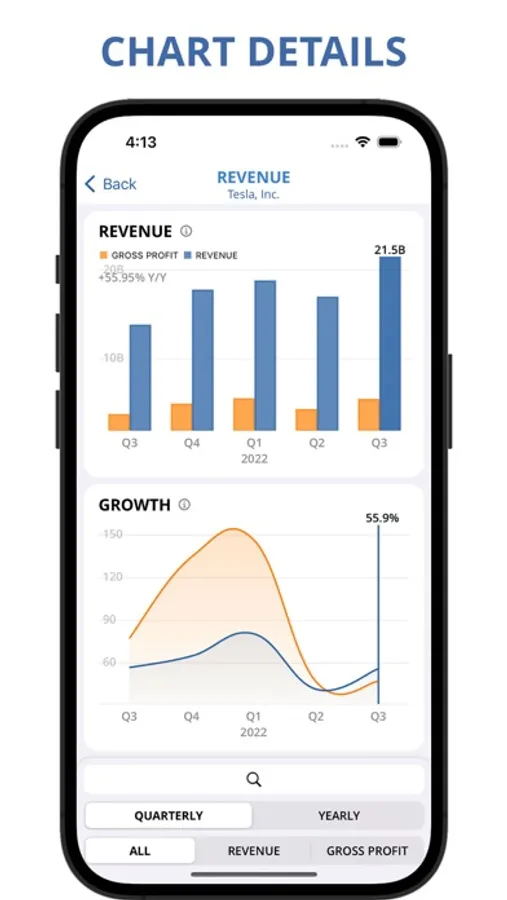
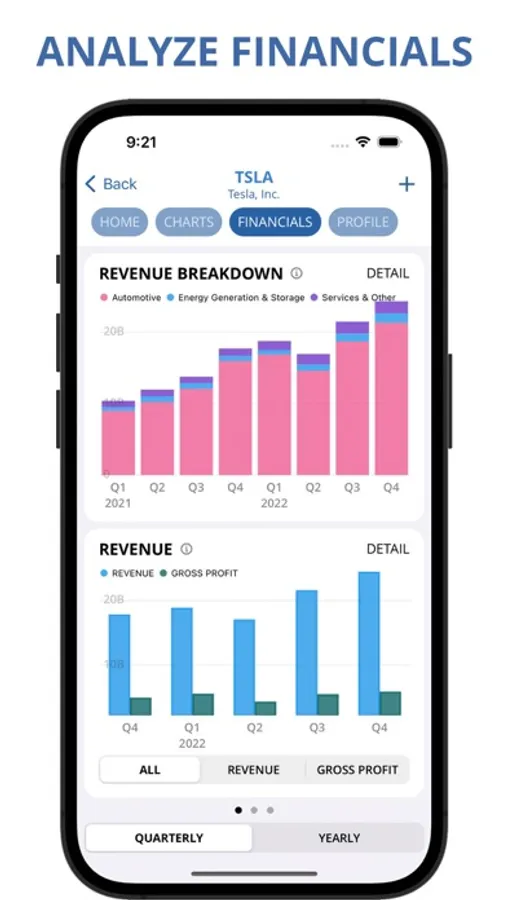
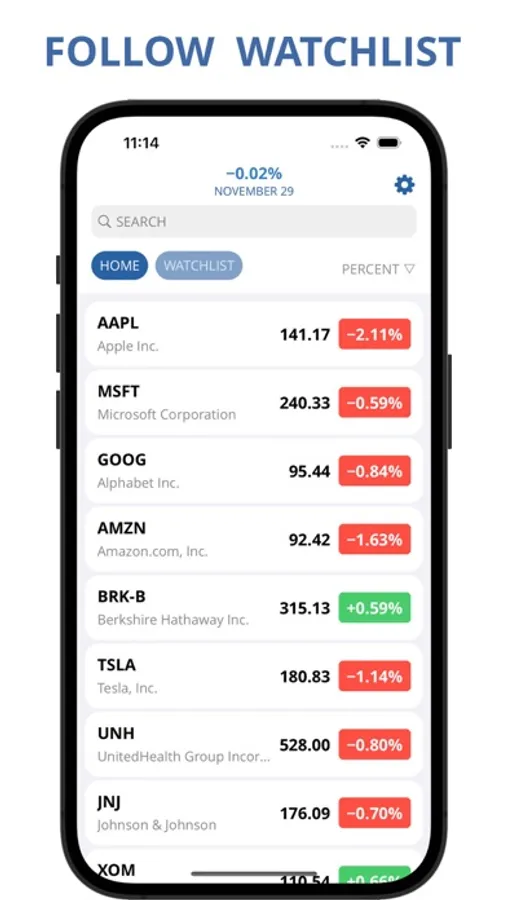
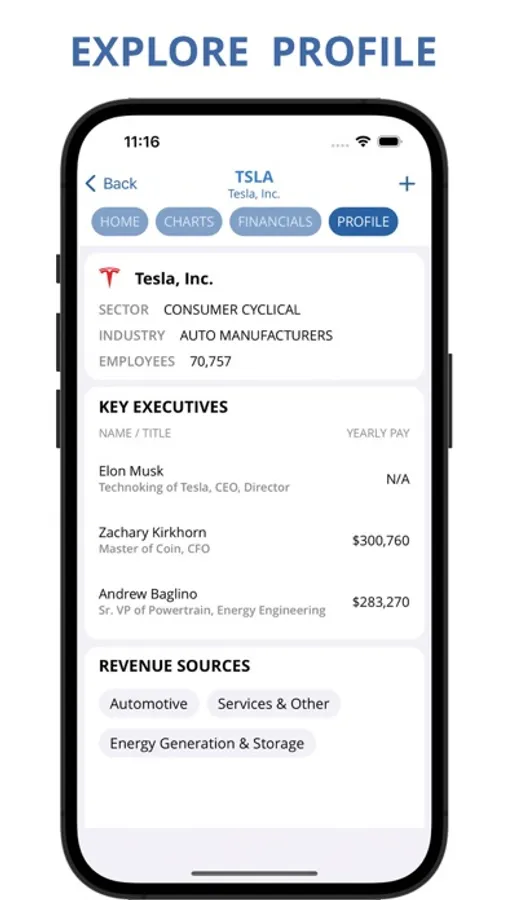
StockChart is the ultimate stock investing research app that is designed with minimalism in mind. Follow your stocks and view their daily performance. Access interactive charts that show prices, financials, and latest trends.
FEATURES
- Interactive charts (line, bar, pie) that show prices, revenue, net income, cash flow, etc.
- Breakdown of revenue sources for each company
- Customizable watchlist that displays percent, change, and market cap
- Simple definitions for every financial metric in the app
Read more about our Terms of use:
https://stockchartsapp.github.io/termsOfUse.html
Stock Charts Screenshots


Tap to Rate:
Reviews for Stock Charts
Fed up Phil
Unable to sign in
Unable to sign in
Carlos from Philly
No ETFs
Great apps, but doesn't seem to have any ETFs.