About Stuff Counter
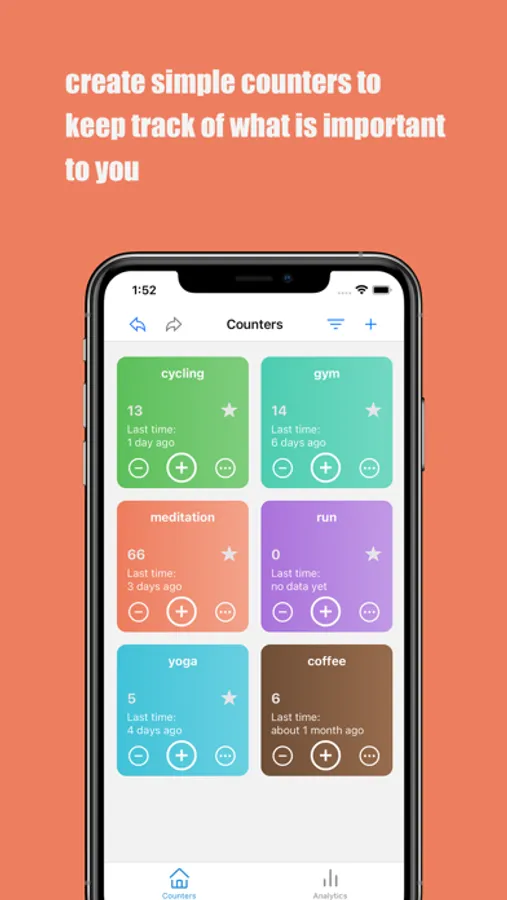
Stuff Counter is simple and effective at what it does - counting stuff you want to count, in a no-friction way, without unnecessary bells and whistles. You can use it to stay on top of things, to stop procrastinating, to track stuff and existing habits, to form new ones, to keep your ADHD in check, it's up to you. We give counters, you give them meaning.
It will be great for counting things like: your workouts, cups of coffee, glasses of water, meditation sittings, journaling sessions, poops of your newborn or a pet, cigarettes smoked, beers drunk, get-togethers with your friends, dates, packs of chips or tables of chocolate you ate, sexual intercourses, instagram posts, blog entries, times you have a hangover, menstruation days, waterpolo games, etc.
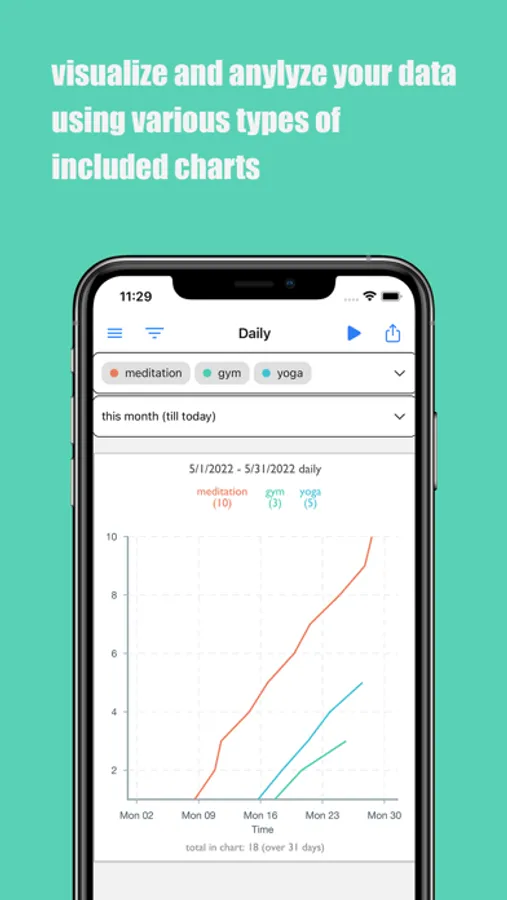
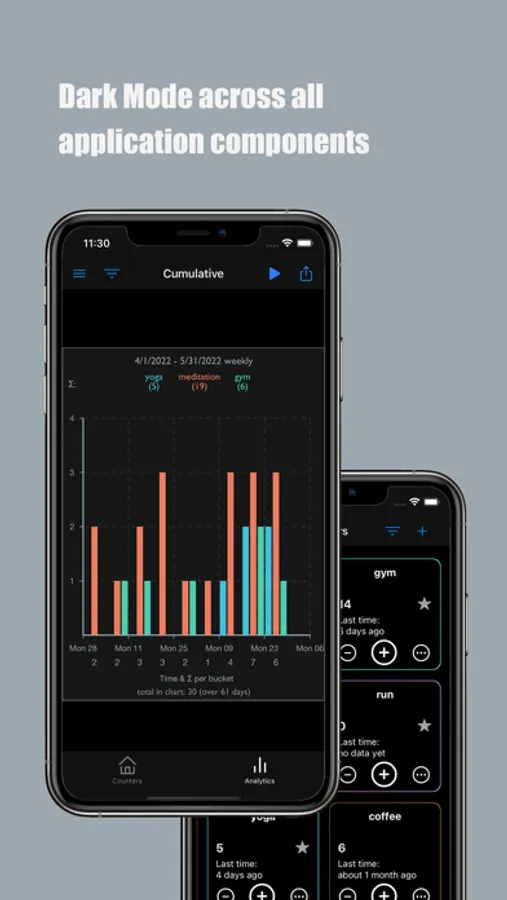
Once you have some data, you can visualize it using charts. This is great great for seeing the big picture and finding dependencies and correlations. 3 types of charts are currently available to show your progression: a simple line chart over time axis, a histogram-style cumulative chart, a heatmap. Looking at the charts you will be able to spot things like: which days of the week you drink too much coffee, when you tend to procrastinate on your workouts, track regularity of your periods, see your average training intensity over a long period of time, see how working overtime affects your private activities and health, and many, many more.
Stuff Counter respects you privacy. No account needed. No data collected. You own the data.
Other features:
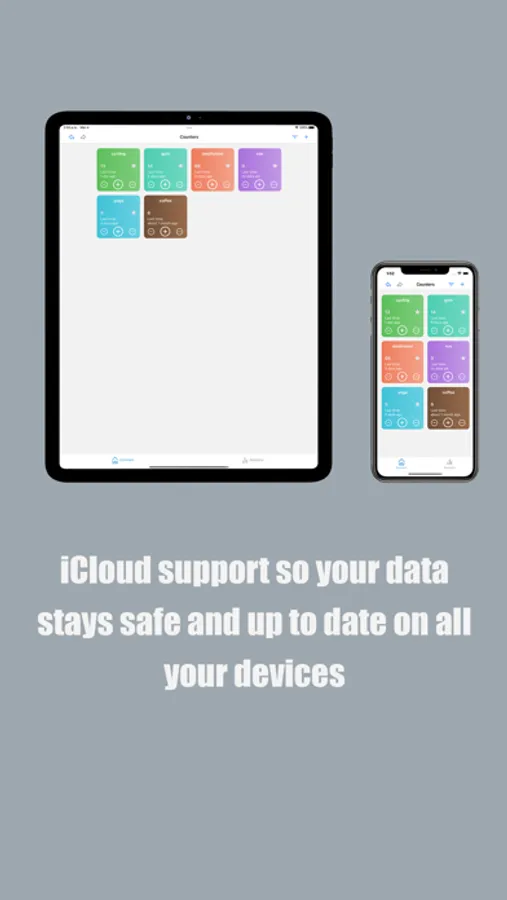
- iCloud integration, so your counters are synchronized across all of your devices and stay safely backed-up
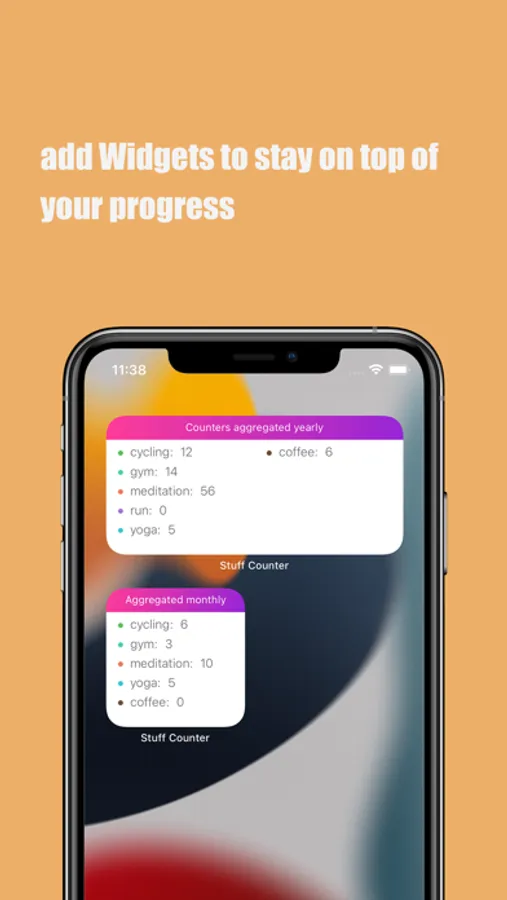
- Widgets - so you stay on top of your counters right from your Home Screen
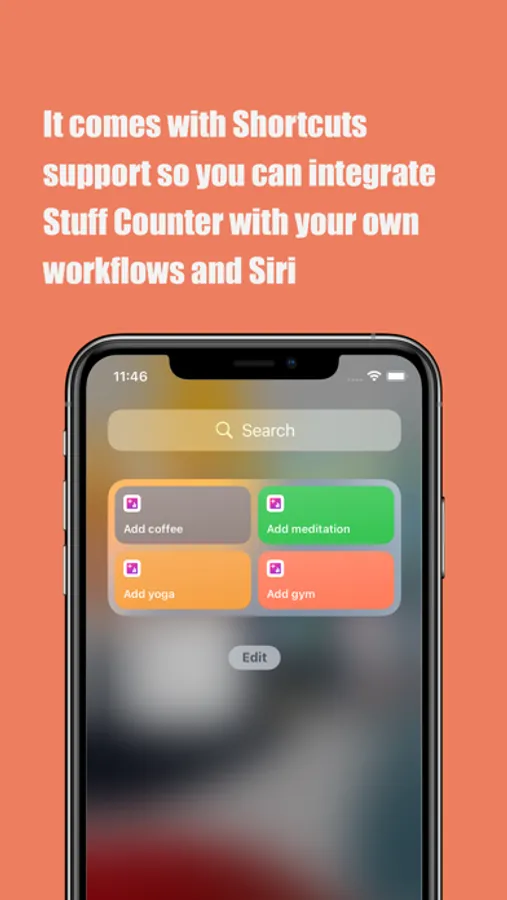
- Shortcuts - so you can integrate Stuff Counter with your existing automation solutions and/or build new ones
- Dark mode - across all application components and charts. Because your eyes deserve it
- it's quite hackable - see the online documentation for more
