About Graph-n
Graph-n is an application that allows you to record various things in your daily life in graphs, share them, and export them as PDF files.Why don't you record things in various fields as logs in graphs and centrally manage them?
[Functions/Features]
・Login not required
You can use it easily without registering as a member or logging in.
・4 types of graphs
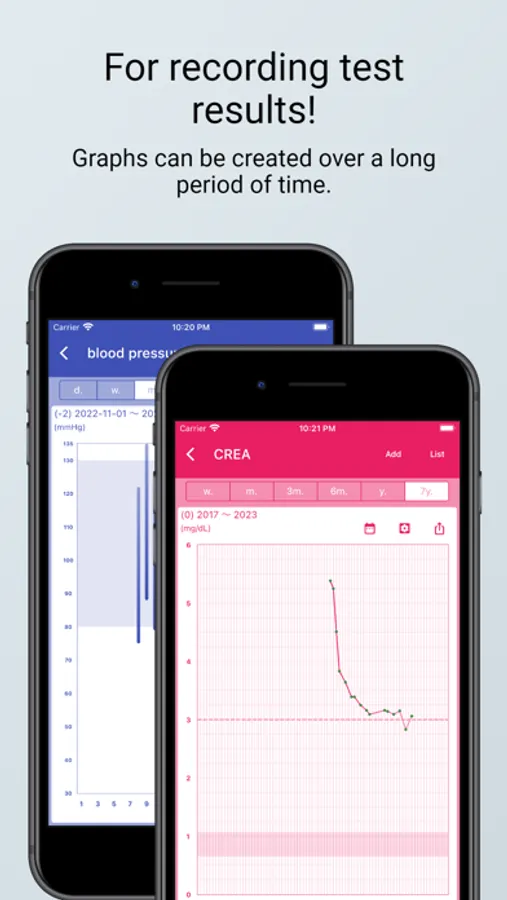
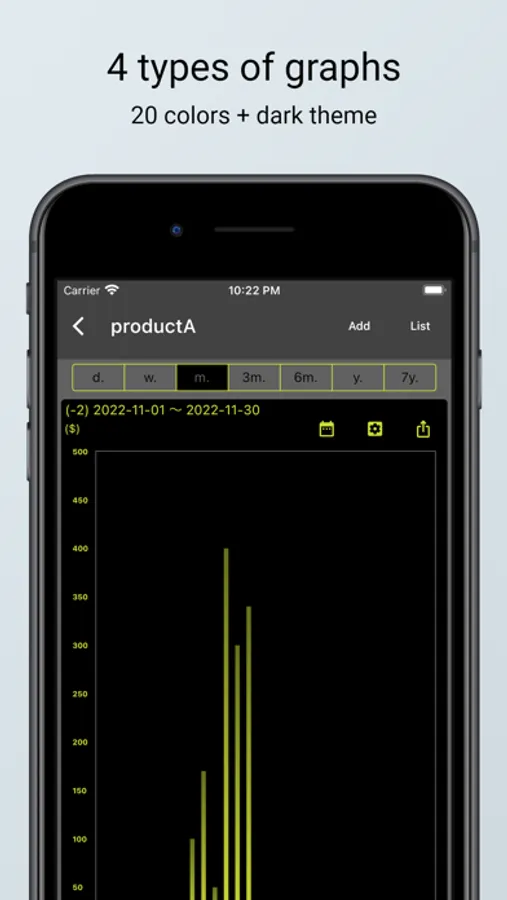
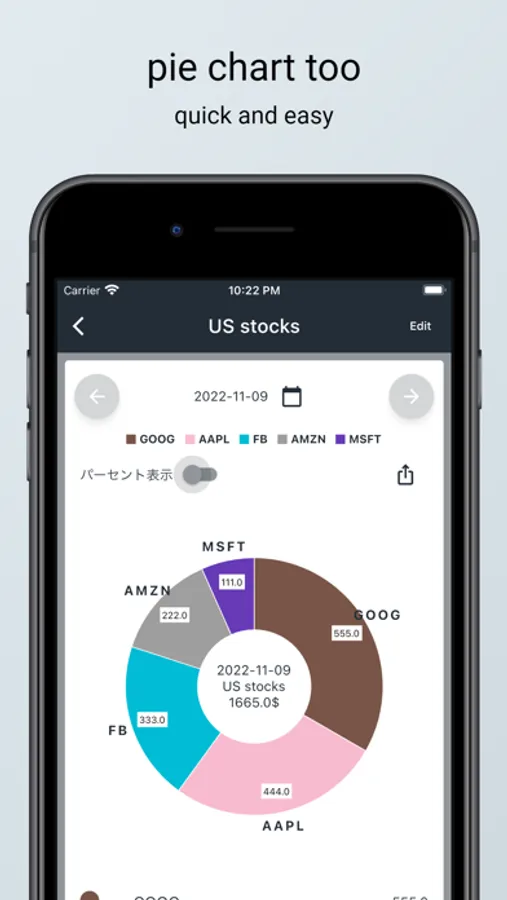
You can choose the best one from four types of graphs: line graph, bar graph, pie graph, and blood pressure graph.
·category
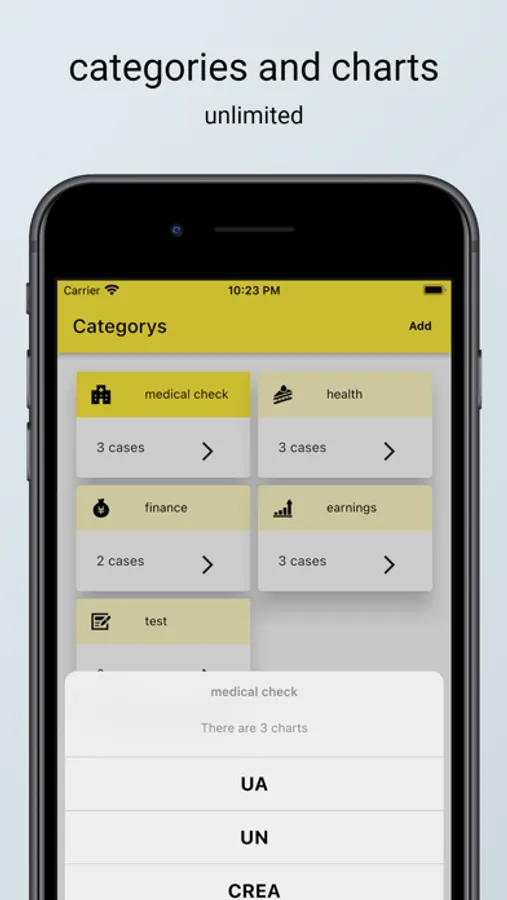
You can freely create categories and organize graphs by category.
·Time series
Since the date (time) when recording data in the graph is retained, it can also be used as a life log. You can also see the daily changes in the pie chart.
・Create unlimited graphs
You can create unlimited categories and graphs.
・PDF (Preview/Save/Print)
Graphs can be exported to PDF for preview/save/print.
You can preview/save/print. Each PDF fits on a single sheet of A4 paper. Save/print as desired. Also, after double-tapping the preview, pinch out to zoom in.
・Sharing
You can easily share graphs with e-mail attachments, Twitter, Line, etc.
・Backup/Restore
If you have a Google account, you can backup and restore to Google Drive. If you make a backup in advance, you can restore the data even when you change the model.
・Selectable color
There are 20 different theme colors.
[Recommended for people like this]
・ I want to manage my physical condition and health by recording my weight and blood pressure every day
・I want to input as I like without Bluetooth cooperation
・I want to record grades, test results, etc. and see the progress
・I want to record the portfolio in chronological order and see the transition
[You can create a graph like this]
・body weight
・blood pressure
・Periodical test results
・Regular hospital test results
・Earnings
・Trade results
・portfolio
etc.


