AppRecs review analysis
AppRecs rating 2.8. Trustworthiness 77 out of 100. Review manipulation risk 20 out of 100. Based on a review sample analyzed.
★★☆☆☆
2.8
AppRecs Rating
Ratings breakdown
5 star
33%
4 star
13%
3 star
0%
2 star
13%
1 star
40%
What to know
✓
Low review manipulation risk
20% review manipulation risk
✓
Credible reviews
77% trustworthiness score from analyzed reviews
⚠
Mixed user feedback
Average 2.9★ rating suggests room for improvement
About Graph
Graph is straightforward:
• Makes graphs from numbers.
• Made by the data visualization expert - VVI®.
• Touch-hold a graph to email, print or save to your Photo Album.
• Plenty of built-in options.
• AirDrop your graph to the most powerful data visualization application on the iPad, Graph IDE.
FEATURES
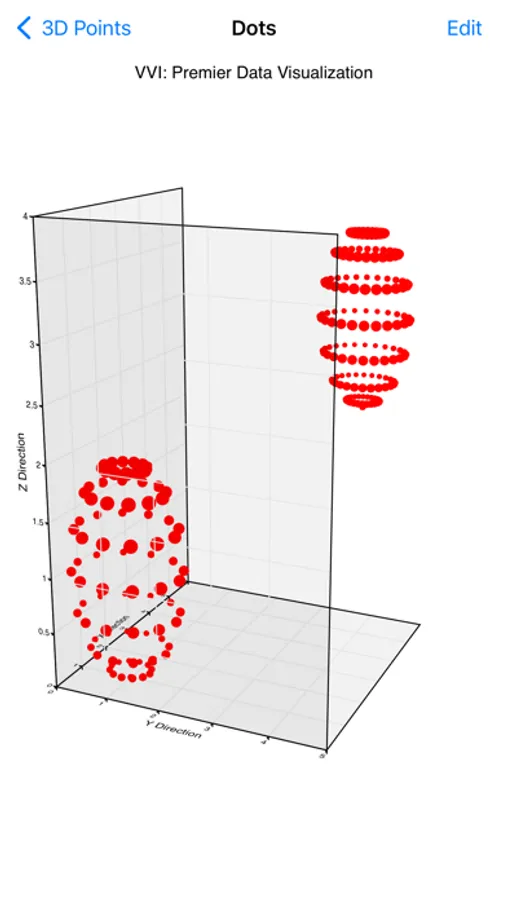
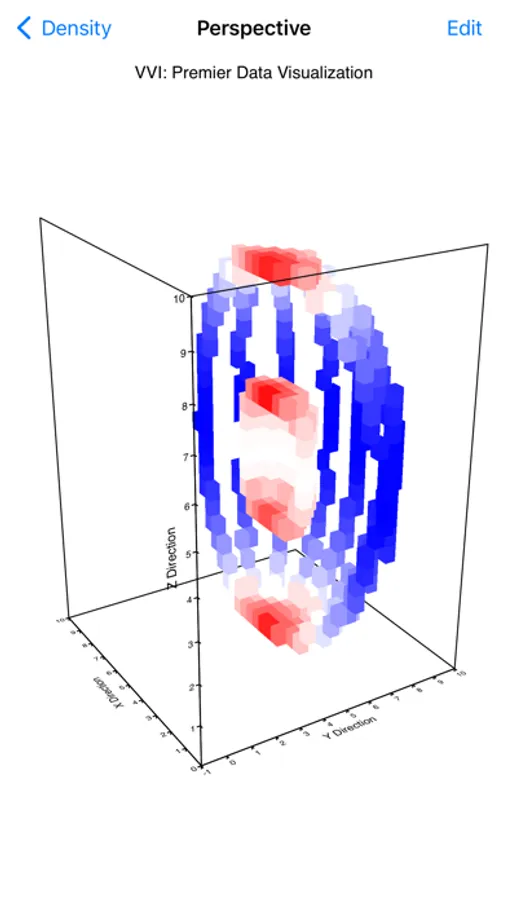
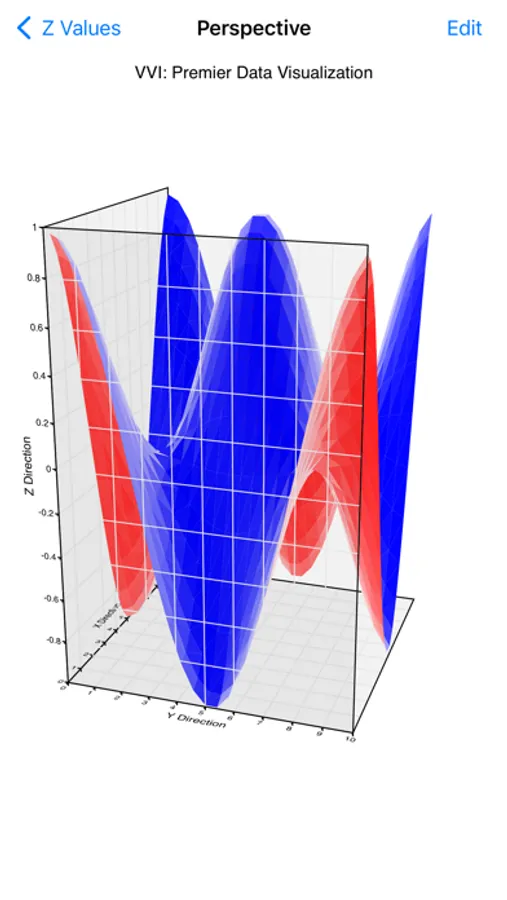
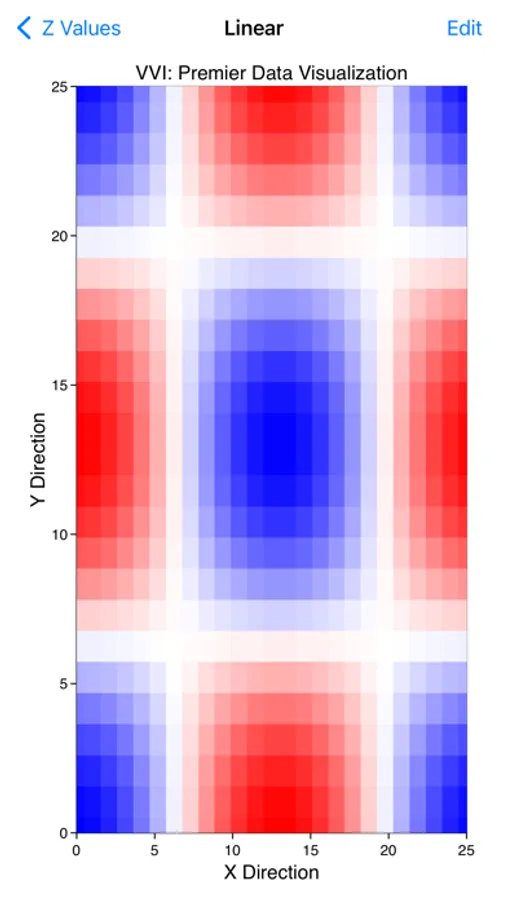
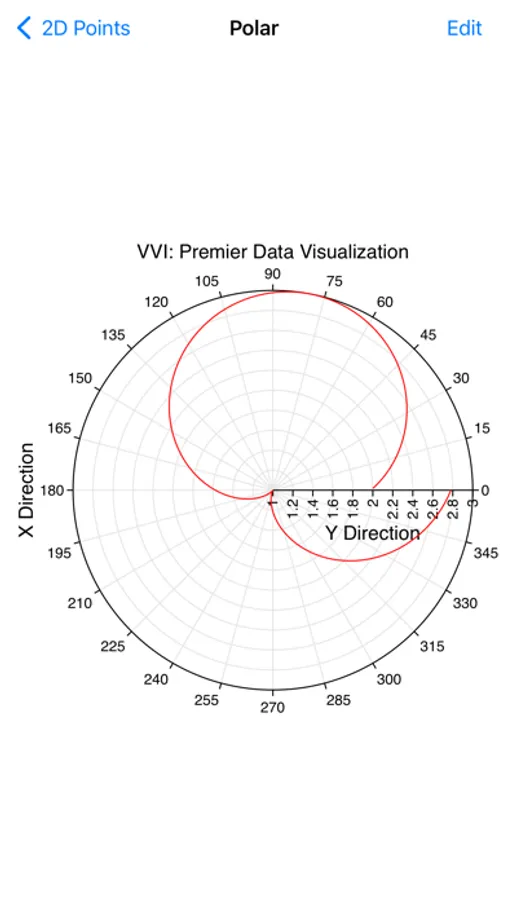
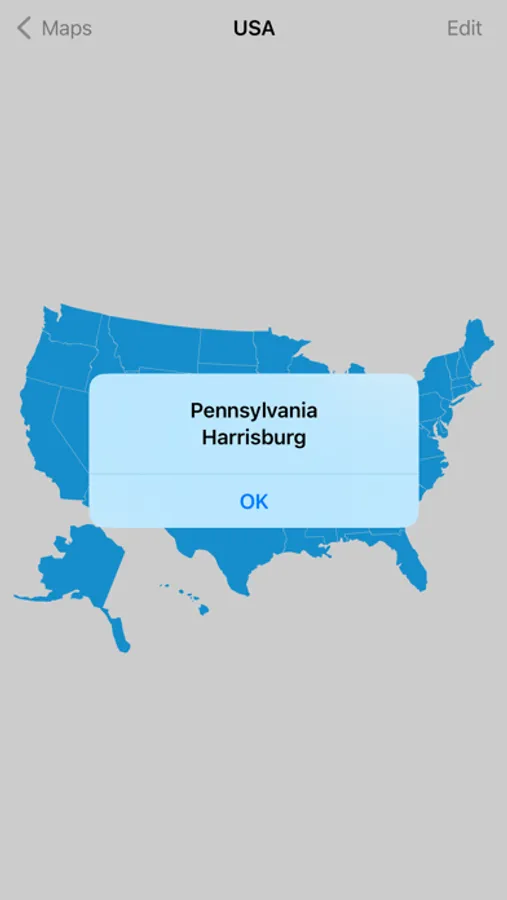
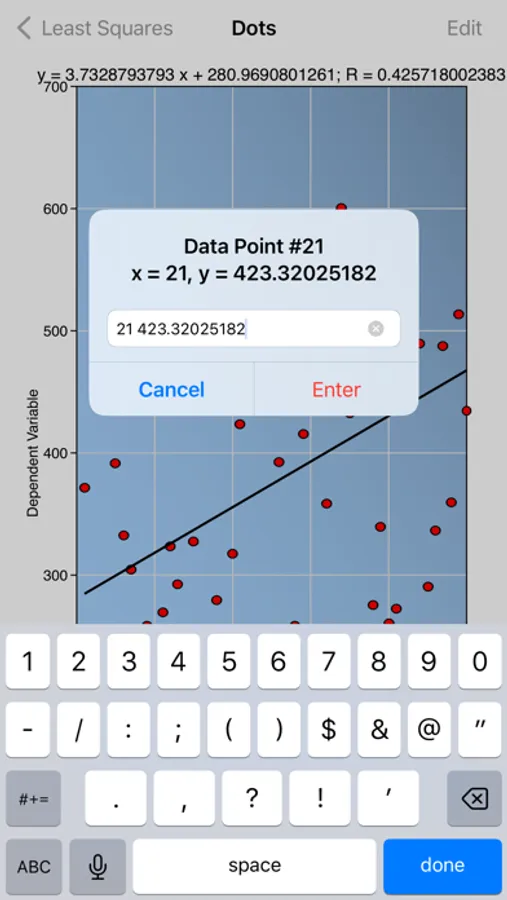
• Includes several 1D, 2D and 3D graph types such as bar, column, pie, line, area, scatter, 3D perspective scatter, trajectory and surface, volumetric, z-sliced cell, maps, linear, semi-log, x-log, log-log, polar, r-log, Gregorian date and many variations.
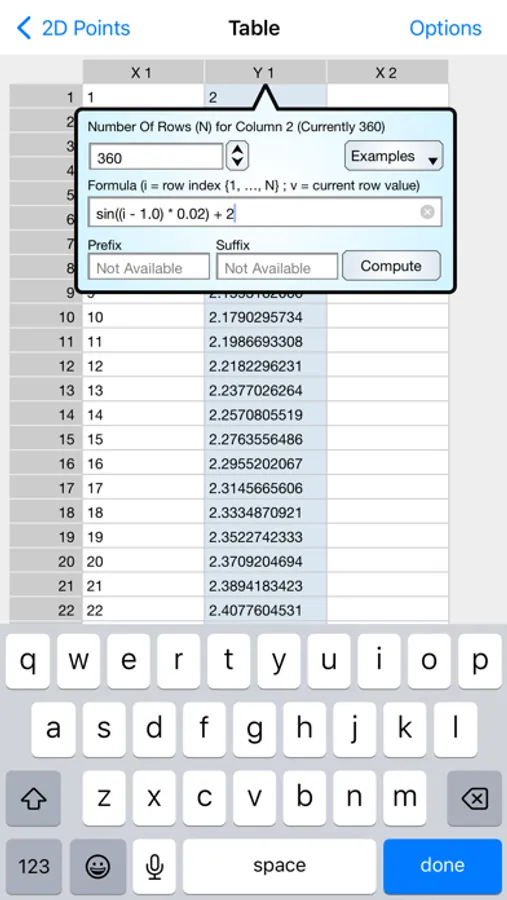
• Data is pasted from the pasteboard and inserted and edited using a table interface.
• Touch-hold a graph to export it to Graph IDE on the iPad. Graph IDE is the most powerful data visualization application for the iPad and gives access to a wide variety of graph types and graphical effects. (Graph IDE is separately available for the iPad).
• Touch graphs to rotate, zoom, scroll and scan data.
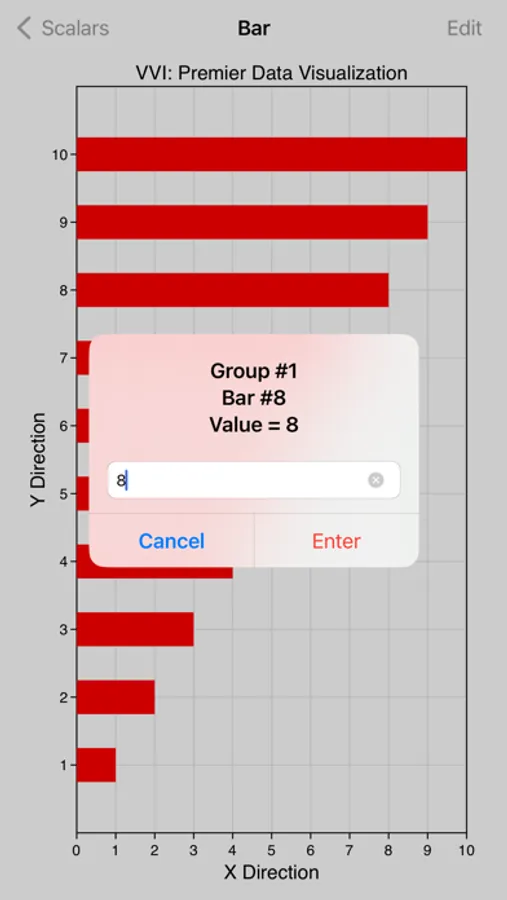
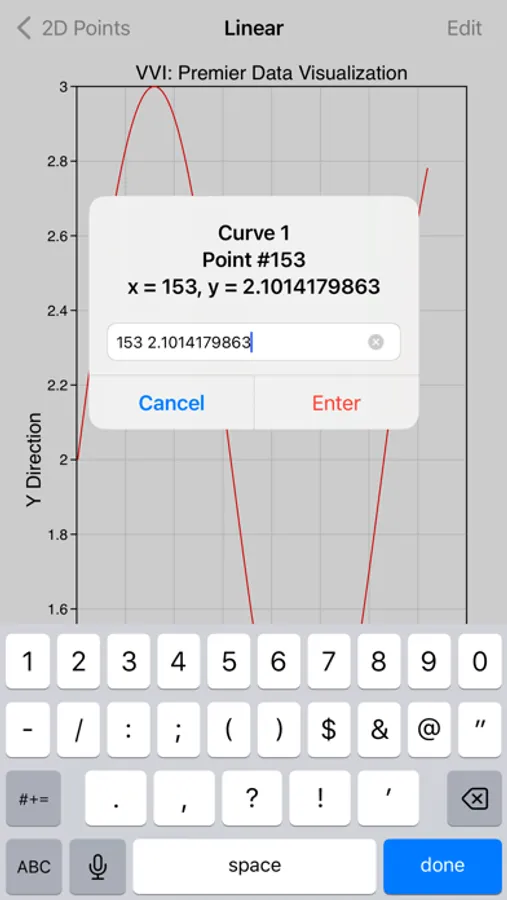
• Touch data graphics, such as lines and bars, to show data values.
• Touch-hold a graph to copy, print, mail, AirDrop and save it to other applications.
• Data and preferences are organized by project and each project is persistent and automatically saved so you can show and retrieve your settings and data on subsequent use.
NOTE: Continued use of GPS running in the background can dramatically decrease battery life. The Location Tracking task requires GPS for its function.
• Makes graphs from numbers.
• Made by the data visualization expert - VVI®.
• Touch-hold a graph to email, print or save to your Photo Album.
• Plenty of built-in options.
• AirDrop your graph to the most powerful data visualization application on the iPad, Graph IDE.
FEATURES
• Includes several 1D, 2D and 3D graph types such as bar, column, pie, line, area, scatter, 3D perspective scatter, trajectory and surface, volumetric, z-sliced cell, maps, linear, semi-log, x-log, log-log, polar, r-log, Gregorian date and many variations.
• Data is pasted from the pasteboard and inserted and edited using a table interface.
• Touch-hold a graph to export it to Graph IDE on the iPad. Graph IDE is the most powerful data visualization application for the iPad and gives access to a wide variety of graph types and graphical effects. (Graph IDE is separately available for the iPad).
• Touch graphs to rotate, zoom, scroll and scan data.
• Touch data graphics, such as lines and bars, to show data values.
• Touch-hold a graph to copy, print, mail, AirDrop and save it to other applications.
• Data and preferences are organized by project and each project is persistent and automatically saved so you can show and retrieve your settings and data on subsequent use.
NOTE: Continued use of GPS running in the background can dramatically decrease battery life. The Location Tracking task requires GPS for its function.
Graph Screenshots
Tap to Rate:
Reviews for Graph
astar175
How to put in data?
How do I put in data? The number disappears. Notice that developer response below me? Yeah, no. No way they’d respond before I’ve already forgotten about the app.
nataliesarah
Too difficult to understand.
Unable to use. Too difficult to understand.