AppRecs review analysis
AppRecs rating 3.0. Trustworthiness 90 out of 100. Review manipulation risk 24 out of 100. Based on a review sample analyzed.
★★★☆☆
3.0
AppRecs Rating
Ratings breakdown
5 star
50%
4 star
0%
3 star
0%
2 star
0%
1 star
50%
What to know
✓
Low review manipulation risk
24% review manipulation risk
✓
Credible reviews
90% trustworthiness score from analyzed reviews
About Stock Position
Stock Position downloads and analyzes market price data of a portfolio of stock assets (NYSE or NASDAQ). It lists the current market price of the individual assets and the portfolio, graphs the price (over the past 10 years) of individual assets and the portfolio, compares the price (over time) to any listed market factor, correlates the rate of return to determine the beta value for the individual assets and the portfolio, and displays the standard deviation and CAPM expected return of the individual assets and the portfolio.
* 8 portfolios of 40 assets each (or 1 portfolio of 5 assets if no subscription).
* quick display of asset and portfolio current values and gain/loss (many values are real time)
* use asset proxies (surrogates) to track intra-day asset values
* weekly beta calculated from any start/end dates
IMPORTANT NOTE: Although initially free, Stock Position requires an In App Purchase subscription (non-renewing) to use many features. A one month initial subscription for each device is included for free.
Screenshots below: (All with similar portfolios)
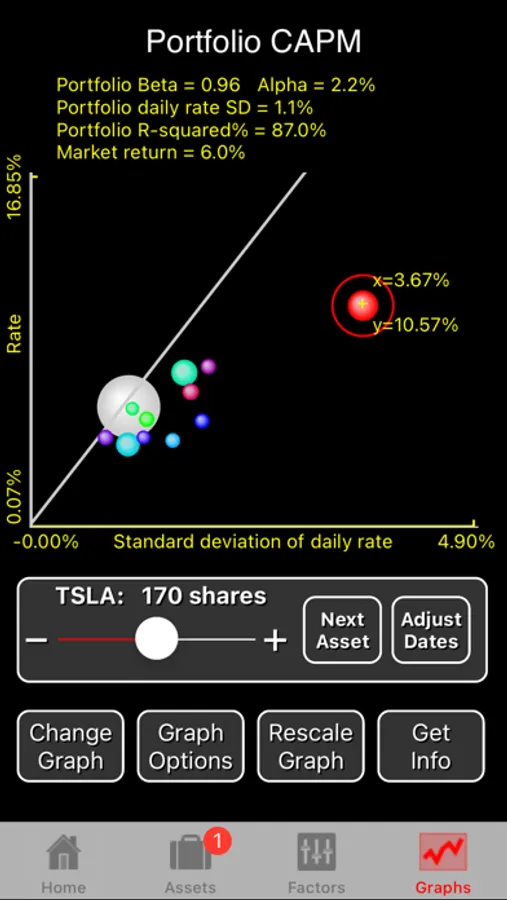
1) CAPM graph showing portfolio diversification with a beta of .96, return slightly better than the market risk with an Alpha of 2.2%.
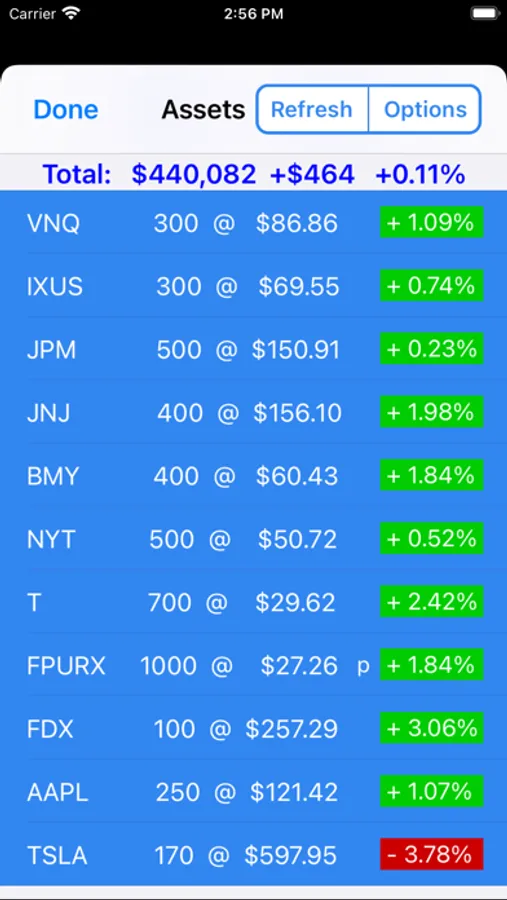
2) asset table - portfolio total is $ down $464 in the day. A proxy (SPY) is used to value the day's change in FPURX.
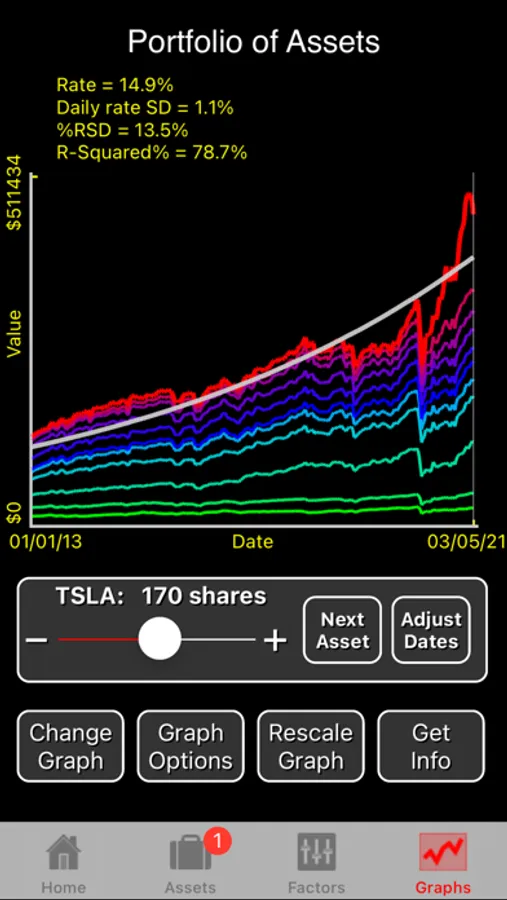
3) stocks graphed cumulatively from 2013 to 2021. Rate of return 14.9%.
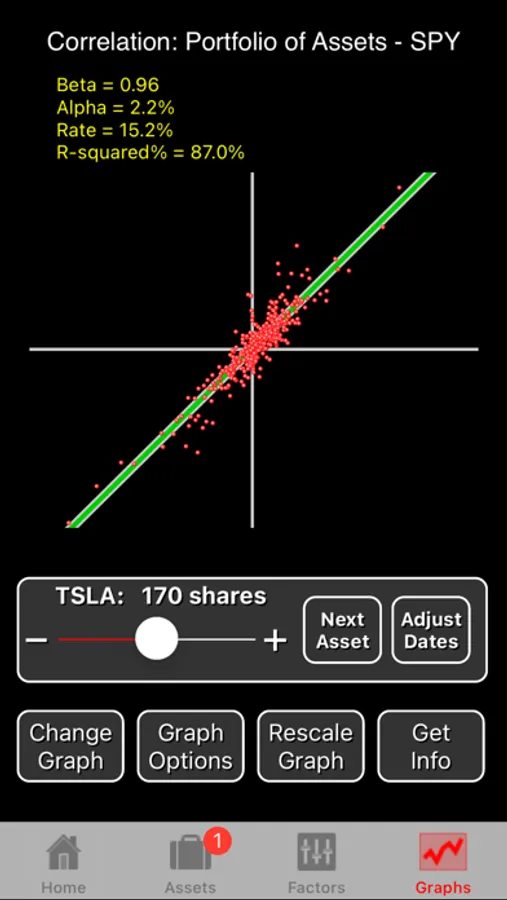
4) Portfolio correlation to a market factor (SPY) showing a beta of .96 since 01/01/13, a return of 15.2% which is 2.2% (alpha) better than the market risk-related return. Beta sensitivity to Start Date is displayed by moving the slider.
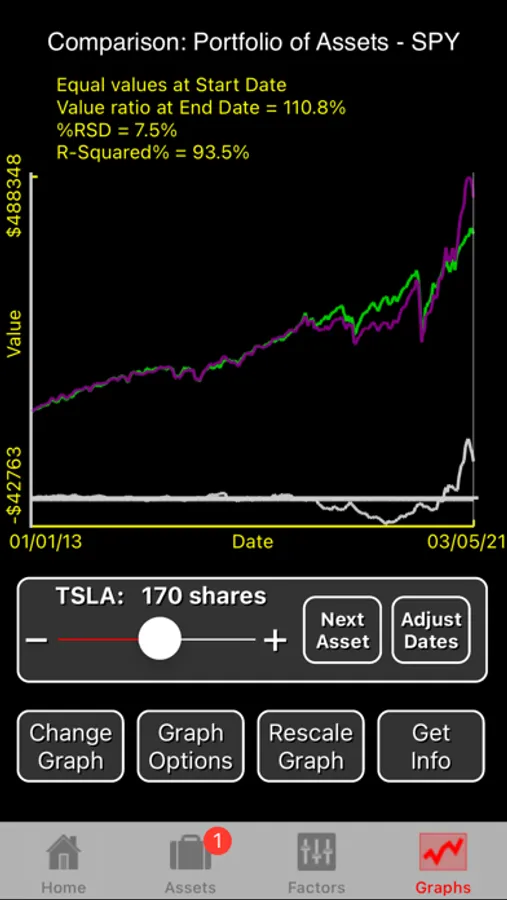
5) Portfolio comparison to a market factor (SPY) showing close correlation with small residuals until recently (due to FDX and TSLA).
* 8 portfolios of 40 assets each (or 1 portfolio of 5 assets if no subscription).
* quick display of asset and portfolio current values and gain/loss (many values are real time)
* use asset proxies (surrogates) to track intra-day asset values
* weekly beta calculated from any start/end dates
IMPORTANT NOTE: Although initially free, Stock Position requires an In App Purchase subscription (non-renewing) to use many features. A one month initial subscription for each device is included for free.
Screenshots below: (All with similar portfolios)
1) CAPM graph showing portfolio diversification with a beta of .96, return slightly better than the market risk with an Alpha of 2.2%.
2) asset table - portfolio total is $ down $464 in the day. A proxy (SPY) is used to value the day's change in FPURX.
3) stocks graphed cumulatively from 2013 to 2021. Rate of return 14.9%.
4) Portfolio correlation to a market factor (SPY) showing a beta of .96 since 01/01/13, a return of 15.2% which is 2.2% (alpha) better than the market risk-related return. Beta sensitivity to Start Date is displayed by moving the slider.
5) Portfolio comparison to a market factor (SPY) showing close correlation with small residuals until recently (due to FDX and TSLA).
Stock Position Screenshots
Tap to Rate:
Reviews for Stock Position
LoLaMC
Does not work at all
Knowing the developer's other apps I am sure this one was pretty amazing, unfortunately it does not seem to work anymore: when opening the app, the following error message appears "web connection fail"...
Stock Trader seeking alpha
Great for correlations
I use this app to compare the historic price of stocks and show how correlated they are (to each other and to indexes). It has great graphics.