About Meta-Data
===Definition data===:
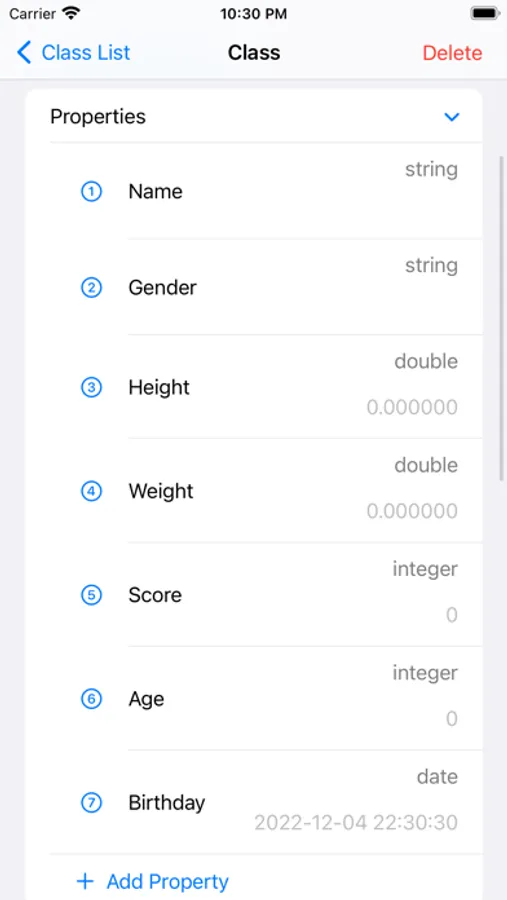
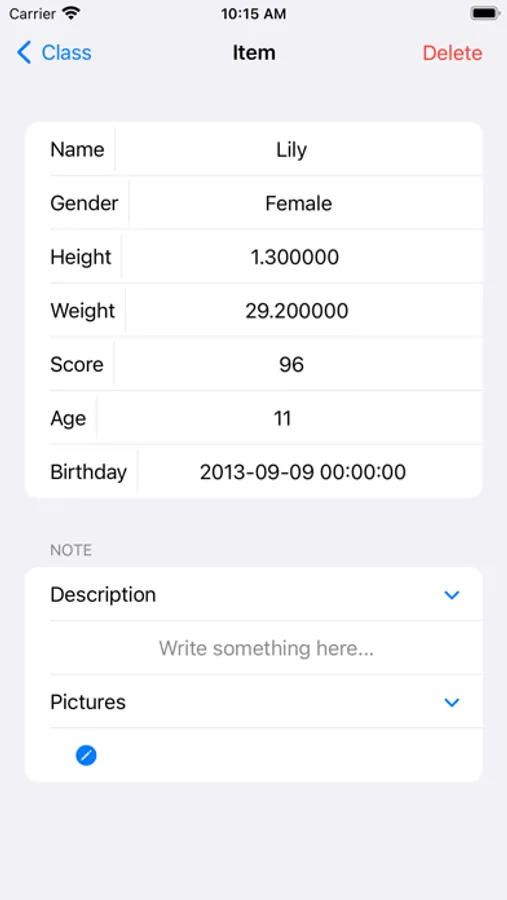
A class of data is described by defining multiple properties. The property type of data class supports integer, text, floating point number and date.
One property of the data class corresponds to one column of multi row and multi column data.
One object of the data class corresponds to one row of multi row and multi column data.
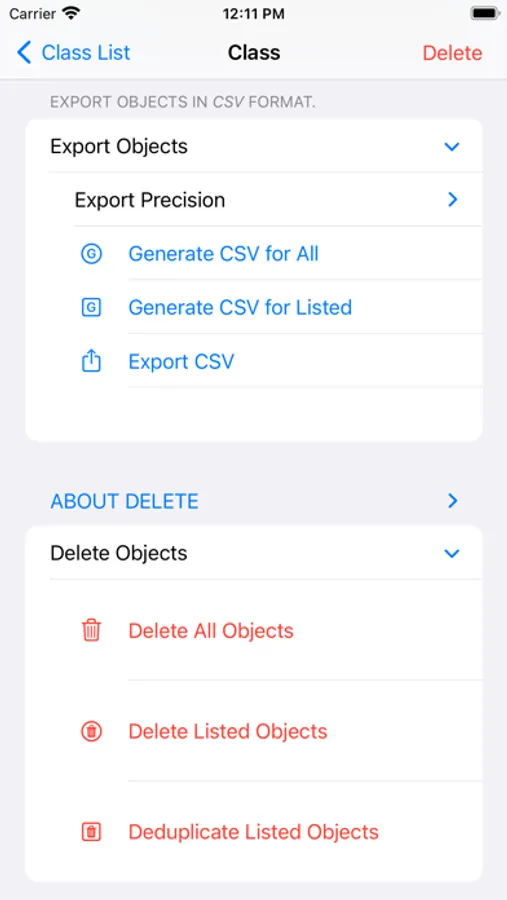
===Edit Data===:
You can add and edit objects, import and export objects in CSV format.
Objects can be imported from CSV files exported from Number or Excel apps.
Or objects can be exported to CSV files to be imported into Number or Excel apps.
Import: Copy text or files in CSV format and paste them into the application.
Export: Copy the text in CSV format from the application and save it as a CSV file.
You can add notes to a single object (text and pictures are supported).
===Exploring data===:
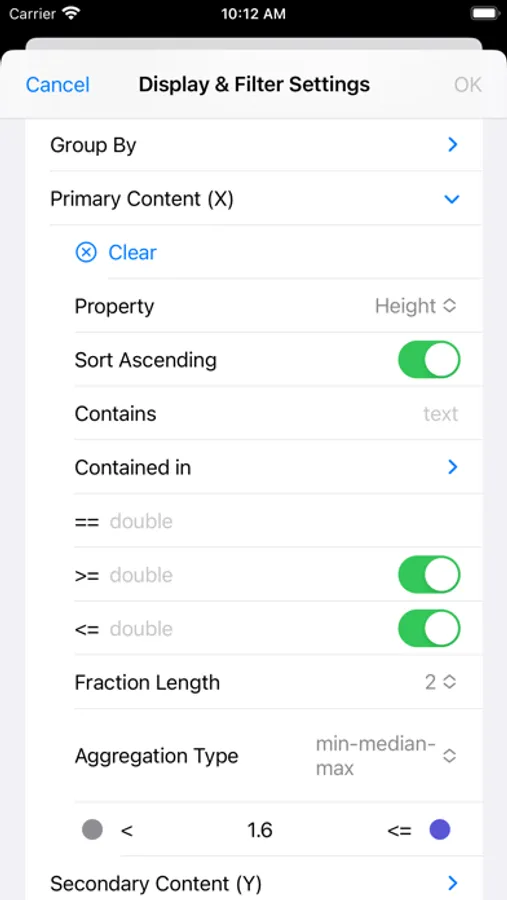
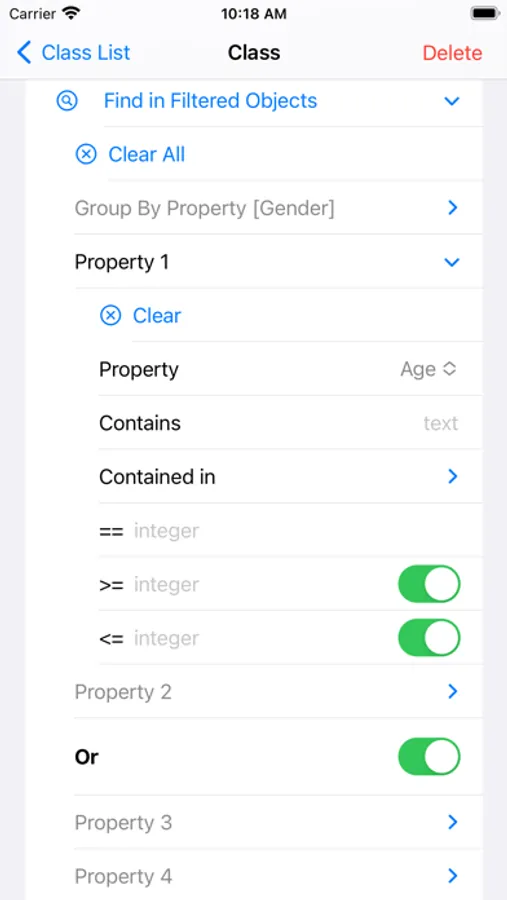
You can filter, group, sort, and display the objects of the data class according to any five properties of the data class.
Three different filtering and display settings are supported.
Support the second quick search on the filtered objects.
Filtering supports multiple conditions (text contain, contained in some text, greater than, less than, equal-to, and not-equal).
Sorting supports ascending or descending order.
Display supports list display and chart display.
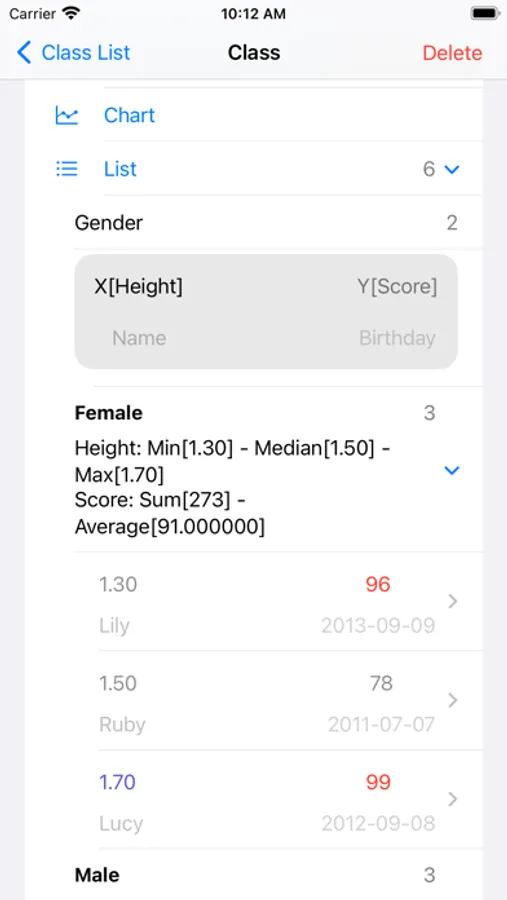
One grouping property and the other four properties you selected optionally will be displayed in the list.
You can set the aggregation type for each property of the other four properties.
Filter conditions, display color and precision can be set for each of the five properties.
The list group header displays the value of the group property and the aggregation information (count, sum, median, average etc.) of the group.
Each row of the list displays four properties of the object according to four importance levels.
Precision settings are used for grouping, filtering, and displaying.
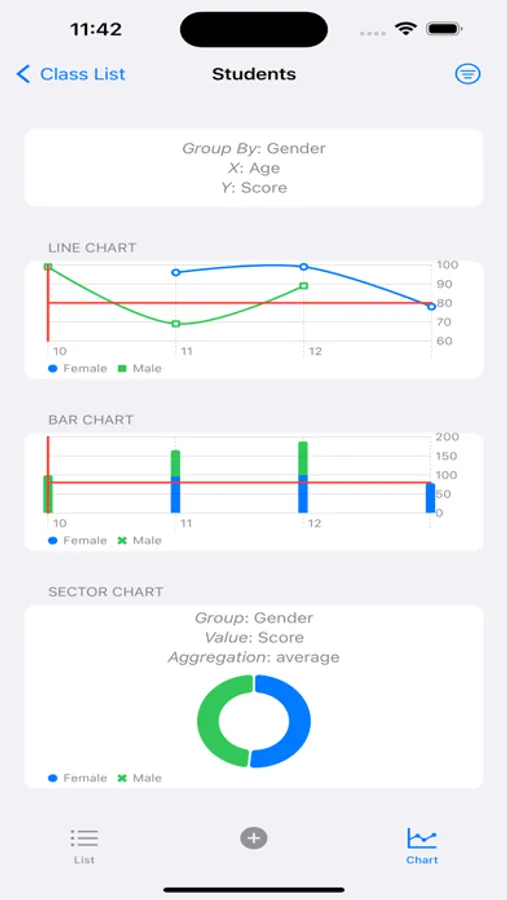
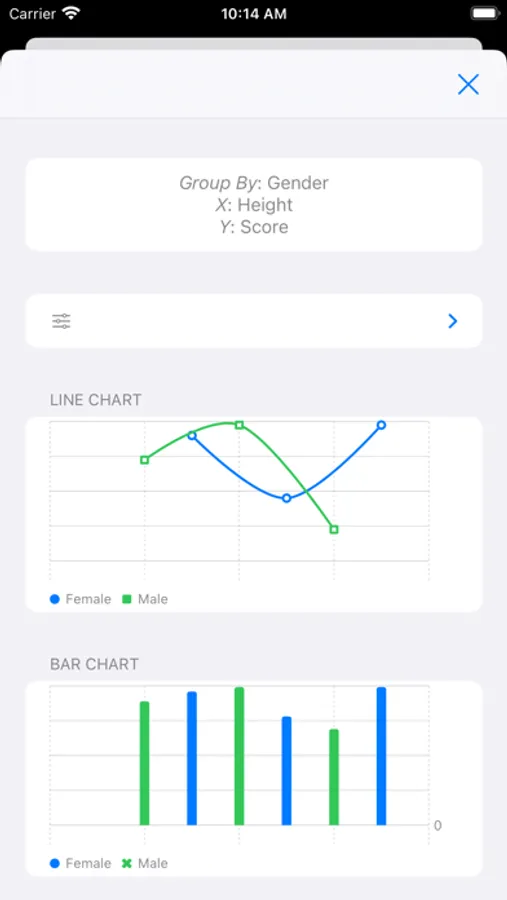
Chart display, grouped by grouping property, with the first two of the other four attributes you select as the X axis and Y axis, displays line chart, bar chart, point chart and area chart.
A sector chart is grouped by the group-by property, displaying the number of groups or the aggregated value of another property.
It means that any two properties can be used as the X axis and Y axis to draw a chart.
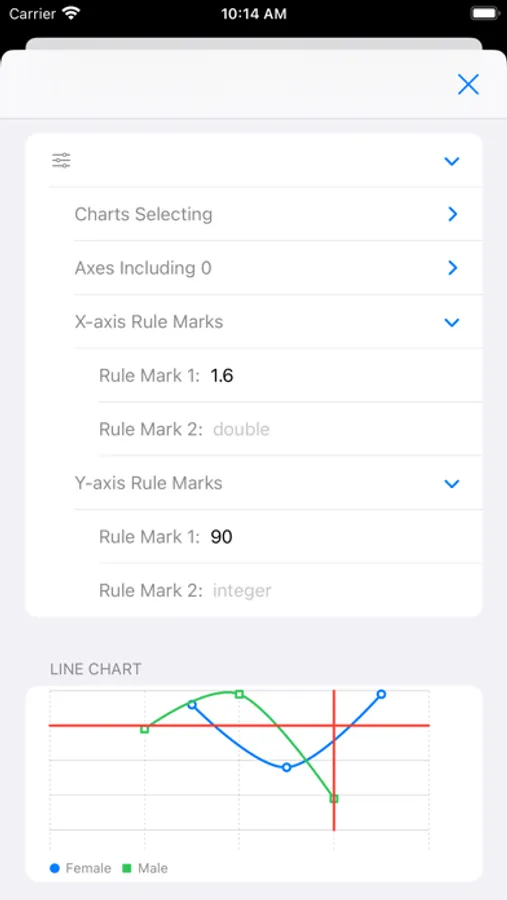
You can set two ruler lines for the X axis or Y axis.
=== Subscription ===:
30 objects can be created and displayed for free.
You can create 99 or 999 objects by subscribing.
After unsubscribing, you can still edit and explore the created objects.
=== EULA ===:
[standard Apple Terms of Use (EULA)](https://www.apple.com/legal/internet-services/itunes/dev/stdeula/)
A class of data is described by defining multiple properties. The property type of data class supports integer, text, floating point number and date.
One property of the data class corresponds to one column of multi row and multi column data.
One object of the data class corresponds to one row of multi row and multi column data.
===Edit Data===:
You can add and edit objects, import and export objects in CSV format.
Objects can be imported from CSV files exported from Number or Excel apps.
Or objects can be exported to CSV files to be imported into Number or Excel apps.
Import: Copy text or files in CSV format and paste them into the application.
Export: Copy the text in CSV format from the application and save it as a CSV file.
You can add notes to a single object (text and pictures are supported).
===Exploring data===:
You can filter, group, sort, and display the objects of the data class according to any five properties of the data class.
Three different filtering and display settings are supported.
Support the second quick search on the filtered objects.
Filtering supports multiple conditions (text contain, contained in some text, greater than, less than, equal-to, and not-equal).
Sorting supports ascending or descending order.
Display supports list display and chart display.
One grouping property and the other four properties you selected optionally will be displayed in the list.
You can set the aggregation type for each property of the other four properties.
Filter conditions, display color and precision can be set for each of the five properties.
The list group header displays the value of the group property and the aggregation information (count, sum, median, average etc.) of the group.
Each row of the list displays four properties of the object according to four importance levels.
Precision settings are used for grouping, filtering, and displaying.
Chart display, grouped by grouping property, with the first two of the other four attributes you select as the X axis and Y axis, displays line chart, bar chart, point chart and area chart.
A sector chart is grouped by the group-by property, displaying the number of groups or the aggregated value of another property.
It means that any two properties can be used as the X axis and Y axis to draw a chart.
You can set two ruler lines for the X axis or Y axis.
=== Subscription ===:
30 objects can be created and displayed for free.
You can create 99 or 999 objects by subscribing.
After unsubscribing, you can still edit and explore the created objects.
=== EULA ===:
[standard Apple Terms of Use (EULA)](https://www.apple.com/legal/internet-services/itunes/dev/stdeula/)
Meta-Data Screenshots
Tap to Rate: