In this graphing calculator app, you can plot equations in various coordinate systems, add sliders for interactivity, and analyze graph features. Includes tools for data tables, statistical analysis, and inequality plotting.
AppRecs review analysis
AppRecs rating 4.3. Trustworthiness 72 out of 100. Review manipulation risk 23 out of 100. Based on a review sample analyzed.
★★★★☆
4.3
AppRecs Rating
Ratings breakdown
5 star
73%
4 star
9%
3 star
4%
2 star
2%
1 star
13%
What to know
✓
Low review manipulation risk
23% review manipulation risk
✓
Credible reviews
72% trustworthiness score from analyzed reviews
✓
High user satisfaction
82% of sampled ratings are 4+ stars (4.3★ average)
About Desmos Graphing Calculator
Features:
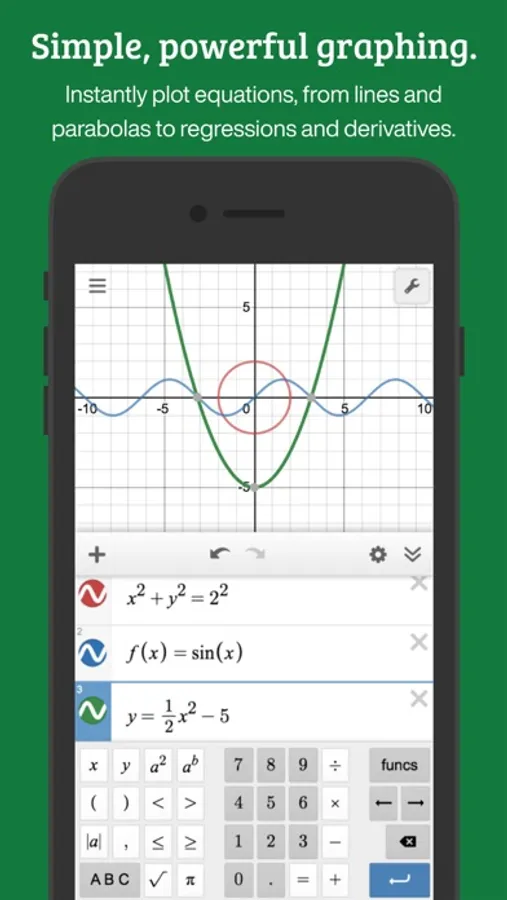
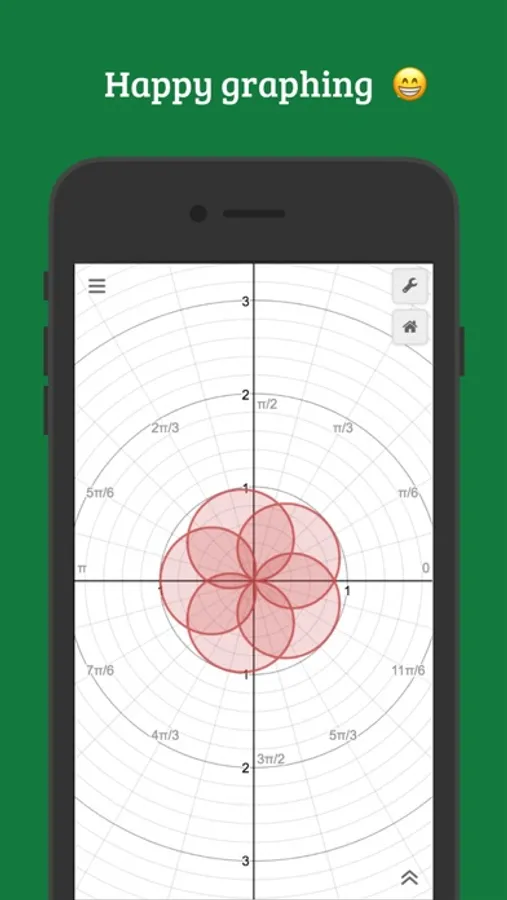
Graphing: Plot polar, cartesian, or parametric graphs. There’s no limit to how many expressions you can graph at one time—and you don’t even need to enter expressions in y= form!
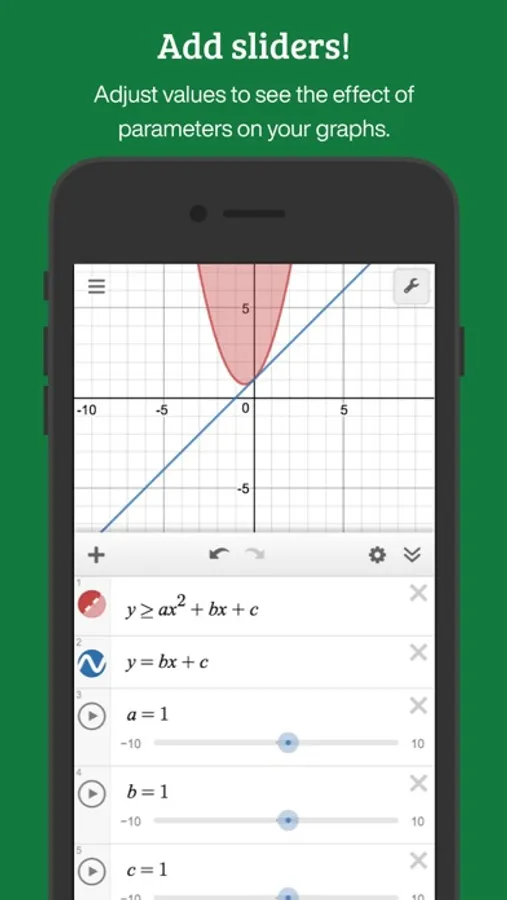
Sliders: Adjust values interactively to build intuition, or animate any parameter to visualize its effect on the graph.
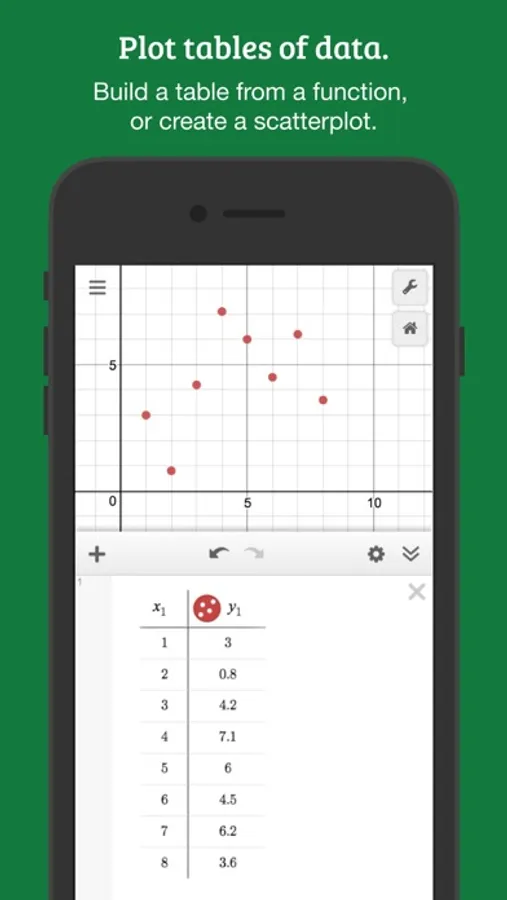
Tables: Input and plot data, or create an input-output table for any function.
Statistics: Find best-fit lines, parabolas, and more.
Zooming: Scale the axes independently or at the same time with the pinch of two fingers, or edit the window size manually to get the perfect window.
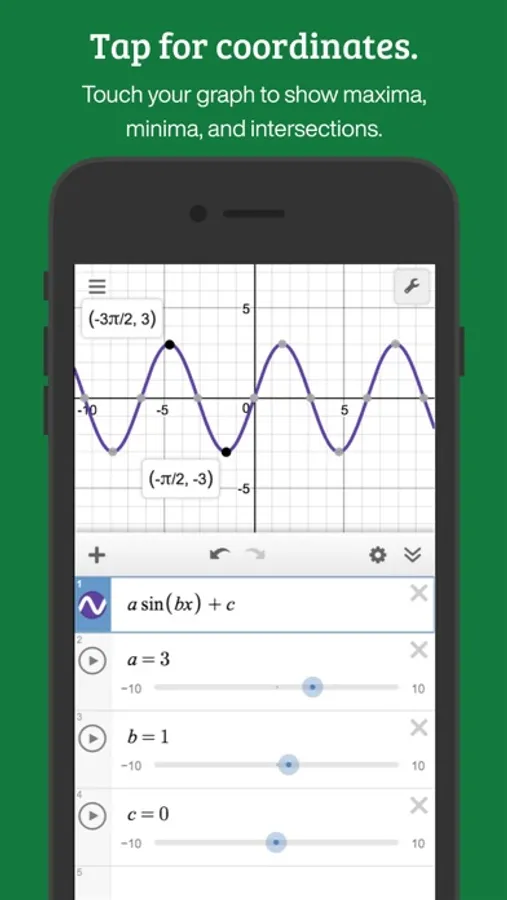
Points of Interest: Touch a curve to show maximums, minimums, and points of intersection. Tap the gray points of interest to see their coordinates. Hold and drag along a curve to see the coordinates change under your finger.
Scientific Calculator: Just type in any equation you want to solve and Desmos will show you the answer. It can handle square roots, logs, absolute value, and more.
Inequalities: Plot Cartesian and polar inequalities.
Accessibility: Read and edit math using a screen reader or a refreshable Braille display, and use audio trace to explore graphs and data through sound.
Offline: No internet access required.
Visit www.desmos.com to learn more and to see the free browser version of our calculator.
Desmos Graphing Calculator Screenshots
Tap to Rate:
Reviews for Desmos Graphing Calculator
StopMakingStupidGames2
Desmos graphics is crazy!
You can make any type of graph, just be careful, sometimes some graphs will not work. But you should always use this app at all times DO NOT DELETE DESMOS. I like the way you can listen to your graph you make and this is great for a math science project! Desmos is the best graphic app that you can get. It has no in app purchases and is really useful for 12 grade math. So if you type 1 (x) it’s just a slanted line. But for 1 |x| it’s different. It’s 2 slanted lines going down and up. This is really cool!
Mykalfaith
Great app, would like access to others
Taking off 1 star for attention. I love this app and use it often. I really would love to have app versions of your other products however - Four Function Tool, Matrix Tool, Geometry Calculator, and 3D Graphing Calculator. Using them on my laptop is less user friendly, in my experience.