About Acid Base pH
Acid Base pH is the ultimate tool for accurate estimation of pH values of acid – base aqueous systems. This application calculates pH values of solutions of weak and strong, monoprotic and polyprotic acids and bases and additionally builds titration curves and provides pH and titrant volume values at equivalent points.
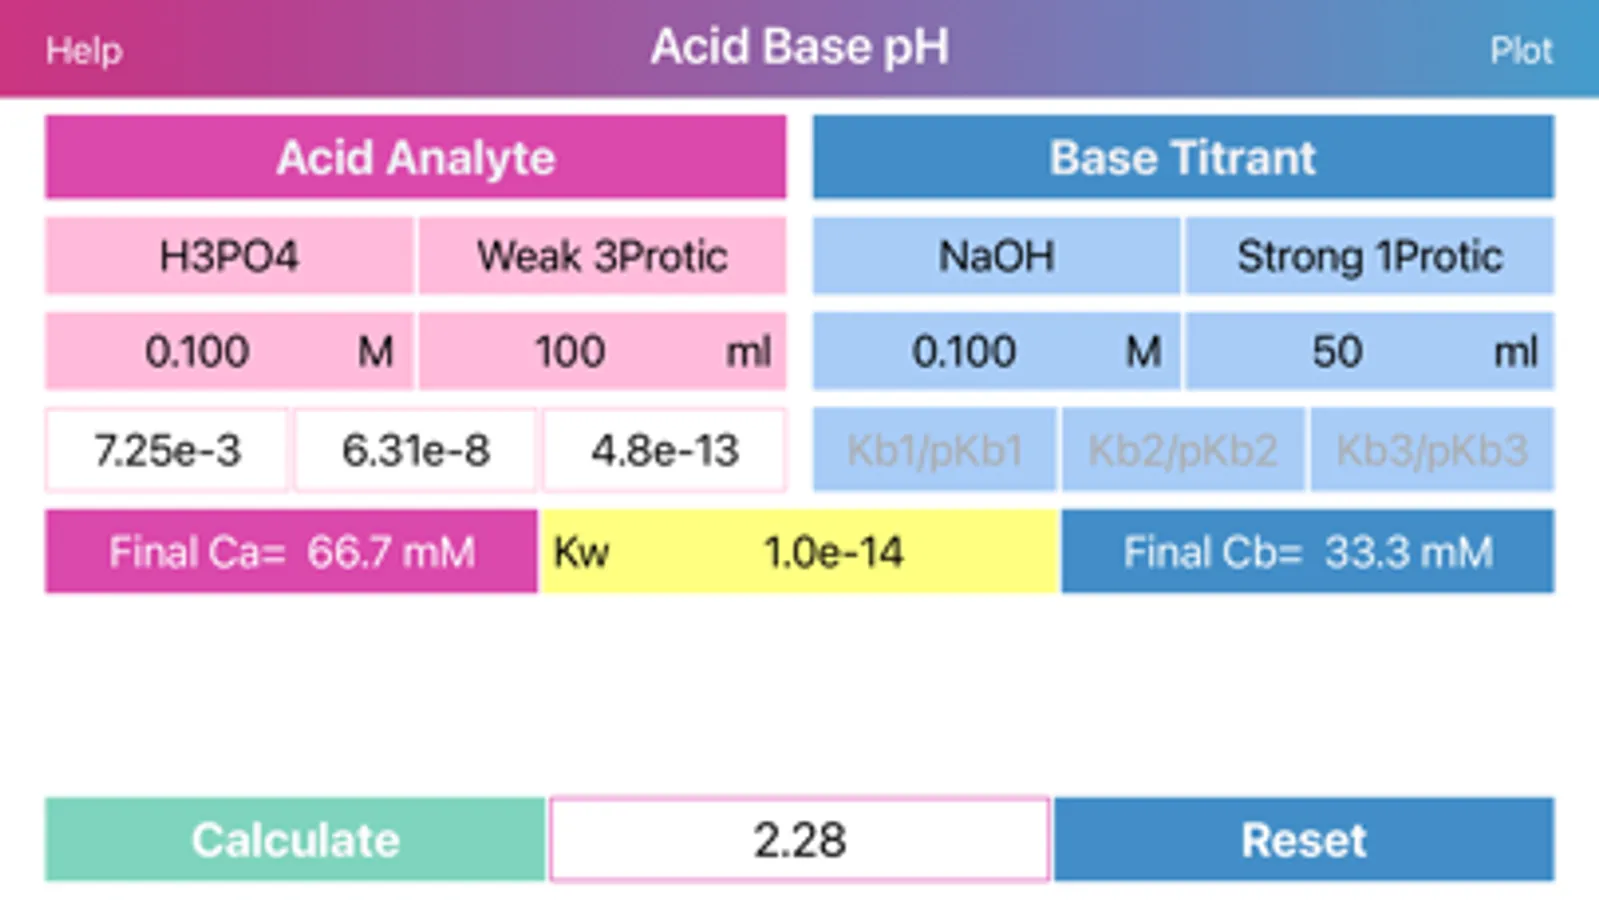
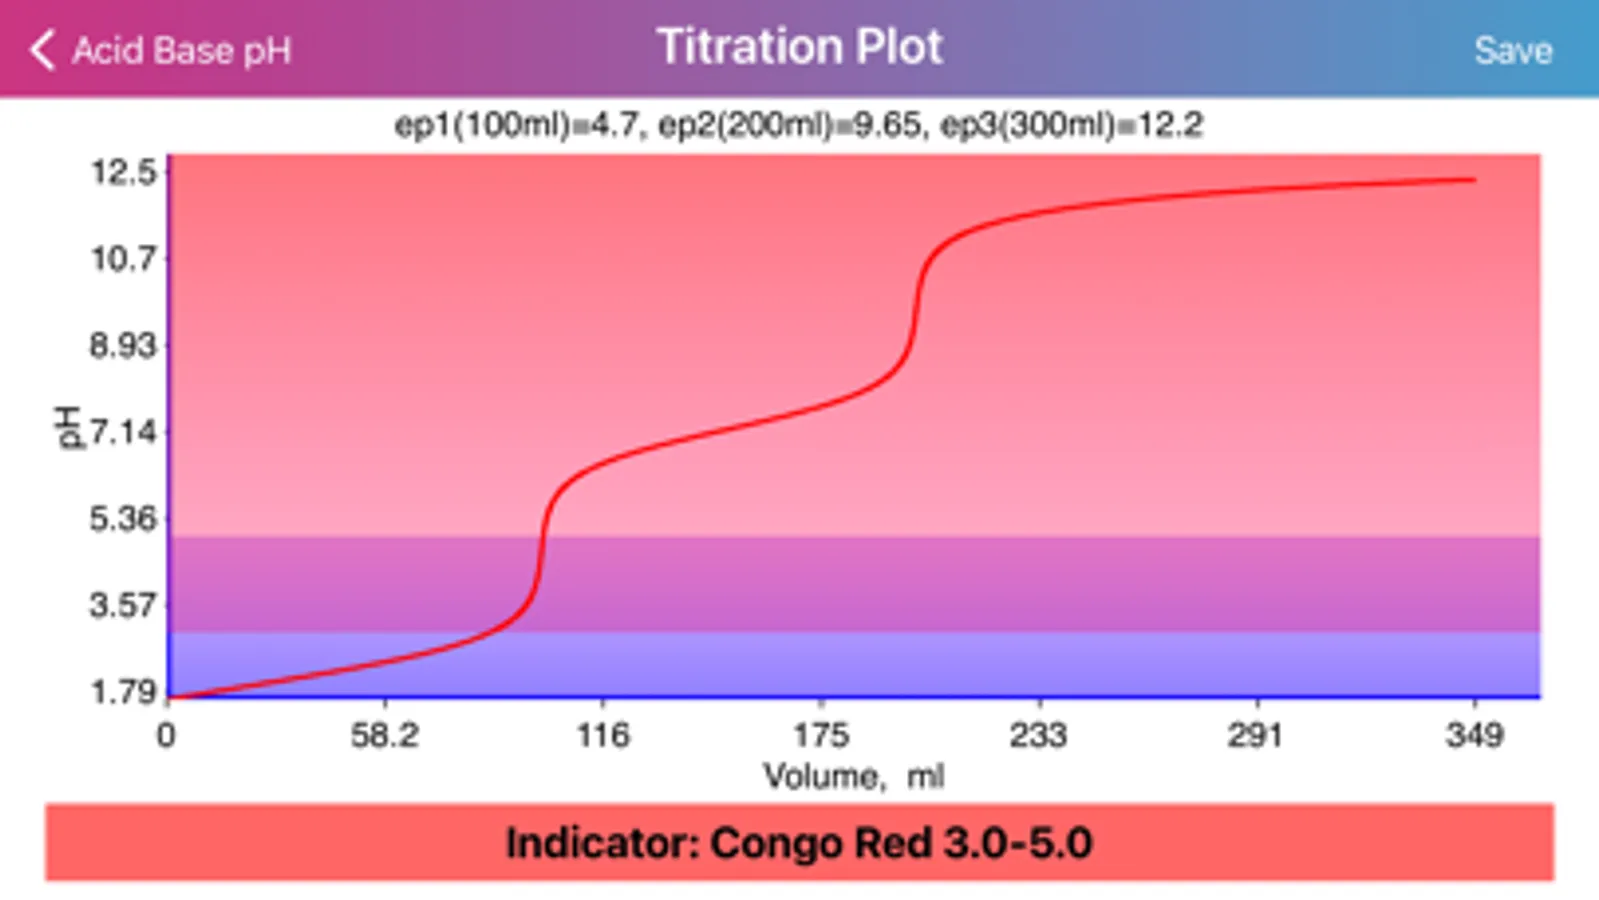
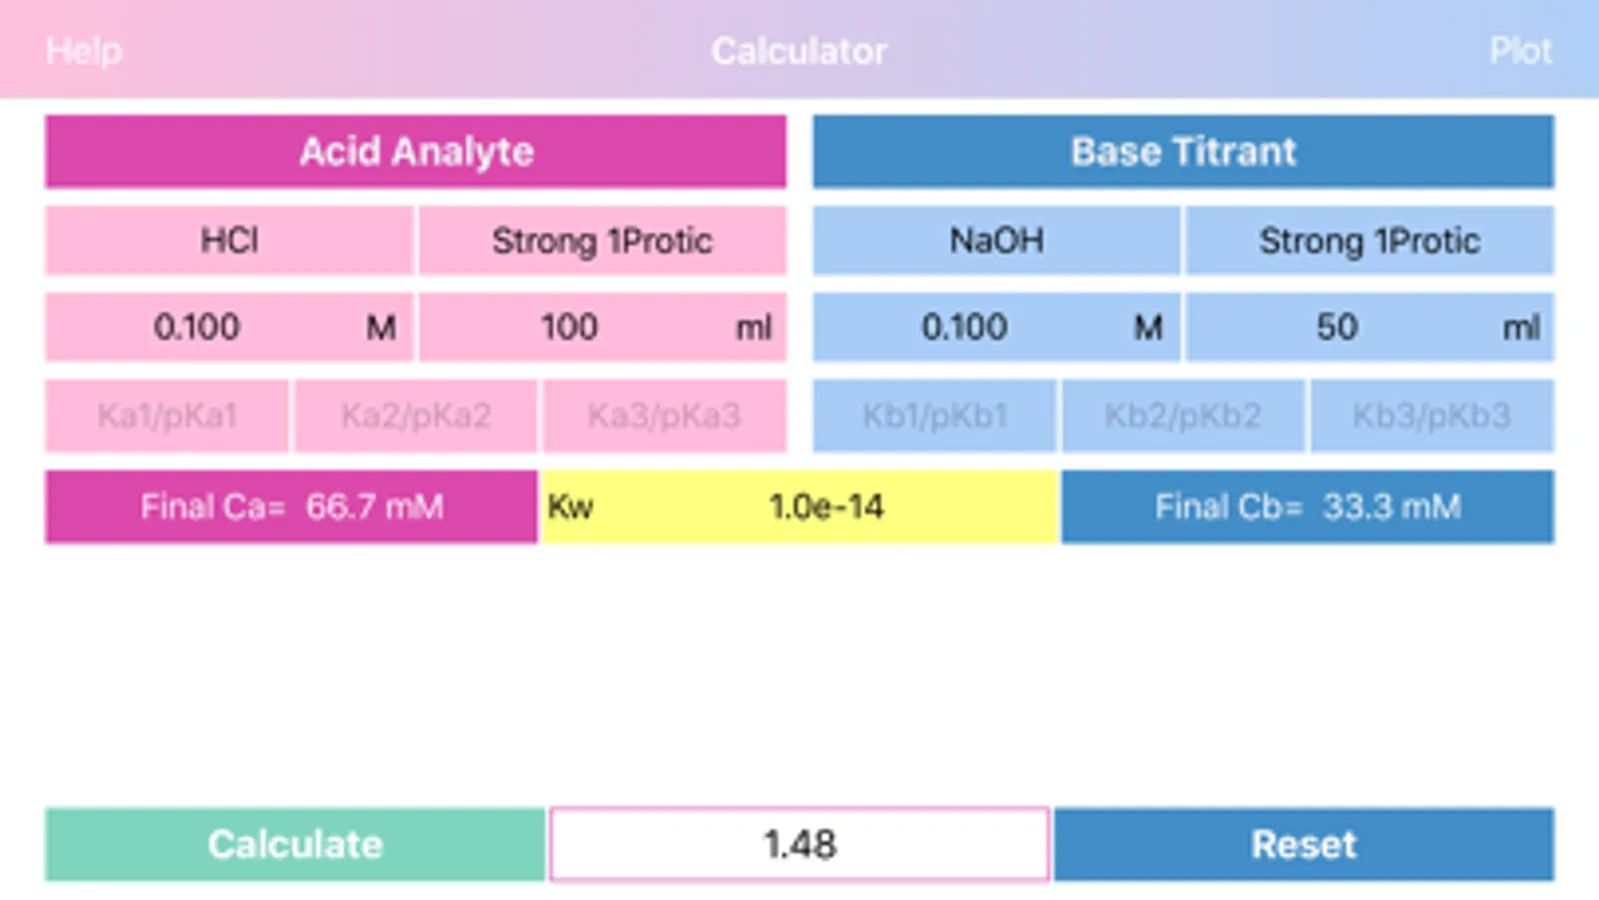
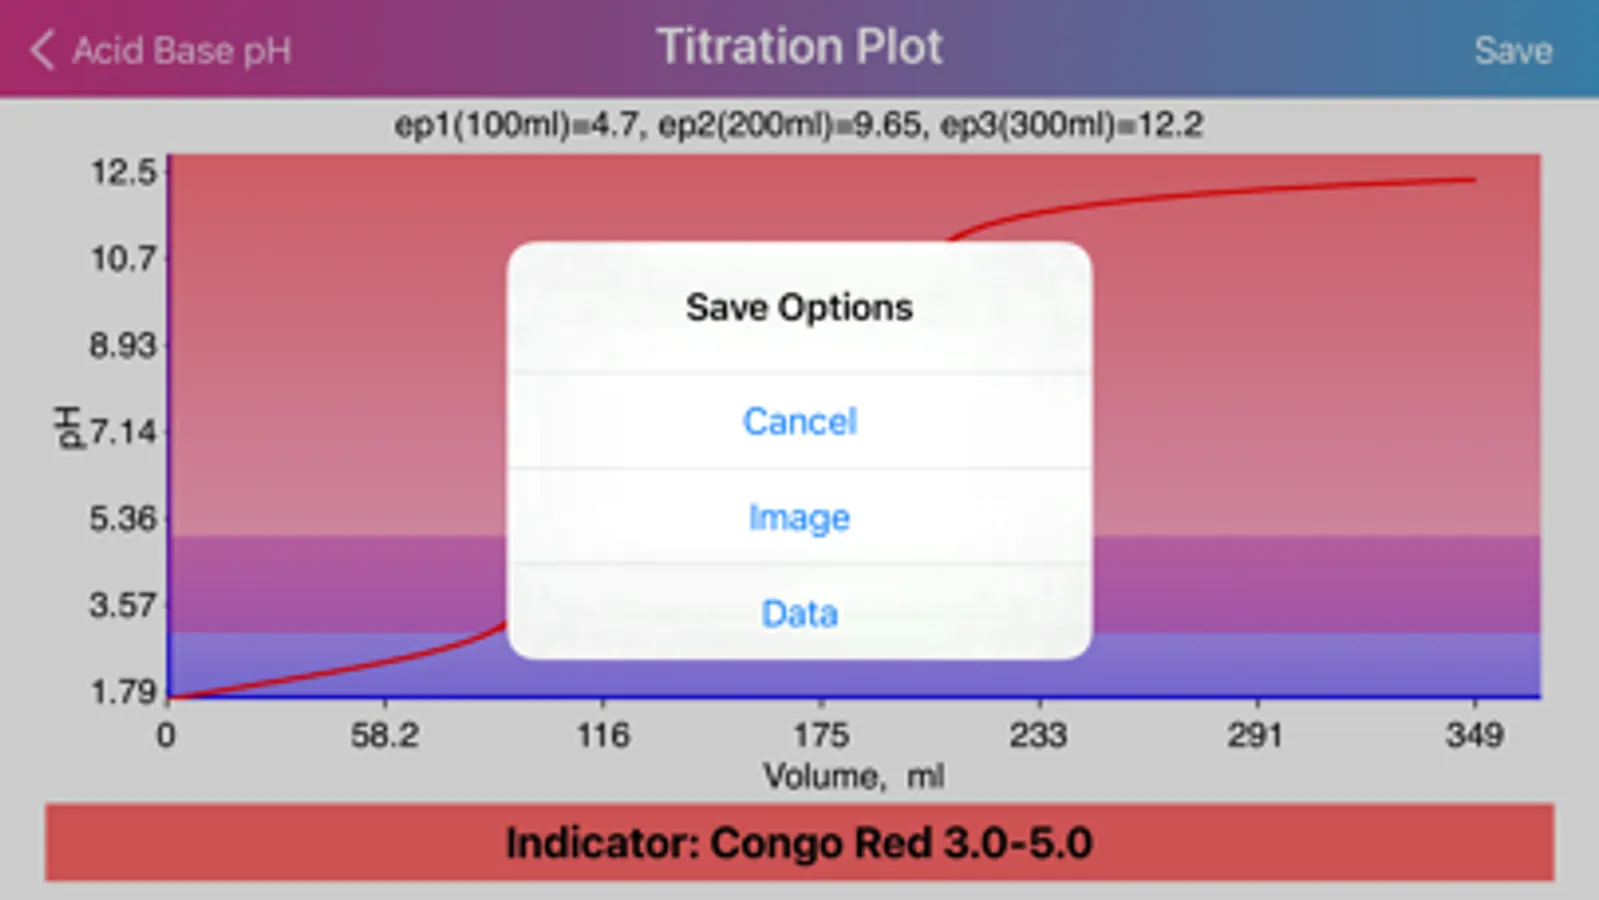
Layout of "Acid Base pH". Screen is divided by two sides: acidic (left) and basic (right), comprising of initial data of solutions, such as molar concentration, volume, proticity and equilibrium constants of first three dissociations. The upper, main field on each side allows to choose if the compound is titrant or analyte and the right field in the second row allows to choose proticity and weakness of acid or base. Important: Titrant compound, by default, can be only monoprotic and strong. When molar concentration of only one initial solution is provided (acid or base side), the application will estimate pH of the single solution. On the other hand, if both solution concentrations are provided, then application will be able to draw titration plot (“Plot” option in the navigation bar), based on titrant-analyte parameters as well as to provide pH and titrant volume values at equivalent points. Furthermore, the plot of titration curve can be exported as an image or as text worksheet. Additionally, it is possible to find titrant volume needed to achieve desired pH value, by entering the pH value to the corresponding field and pressing “Calculate” button.
Application features.
·Estimation of solutions pH values is based on advanced quantitative chemical analysis which allows simultaneous calculation of all dissociation stages of acid and base and water dissociation (Kw).
·Application can plot titration curve and export it as an image or data file to the “Acid Base pH” directory in the “Documents” fiolder.
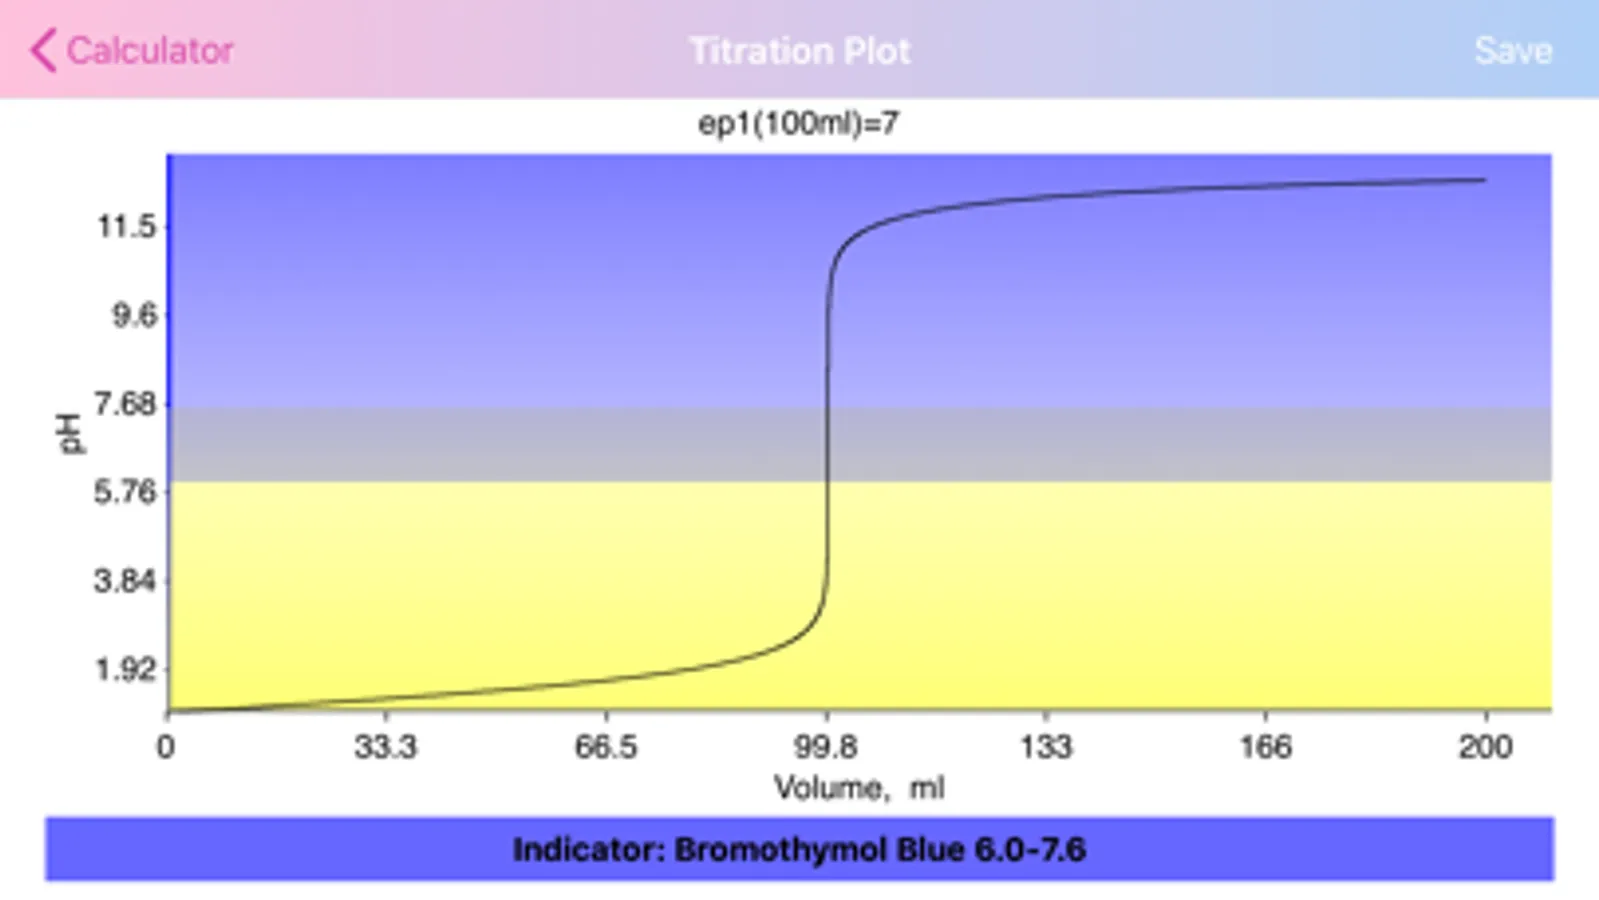
·Application provides pH and titrant volume values at equivalent points.
·Water dissociation constant (Kw) can be adjusted to meet any custom conditions (temperature, etc.).
·Application is able to estimate the titrant volume needed to achieve desired pH values (within titration range), that is particularly useful for buffer preparation.
·The dissociation constants fields accept both formats: 1) pK values (-log(K)) as a simple decimal values and 2) regular K values, in scientific format only, that requires including of exponential part “e” (for example: 1e-5 instead of 0.00001, or 2.5e0 instead of 2.5). Empty dissociation constant field would imply that this dissociation step is “strong” or complete.
·Long press on “Calculate” button shows pOH and [H+] and [OH-] concentration values, corresponding to the current pH.
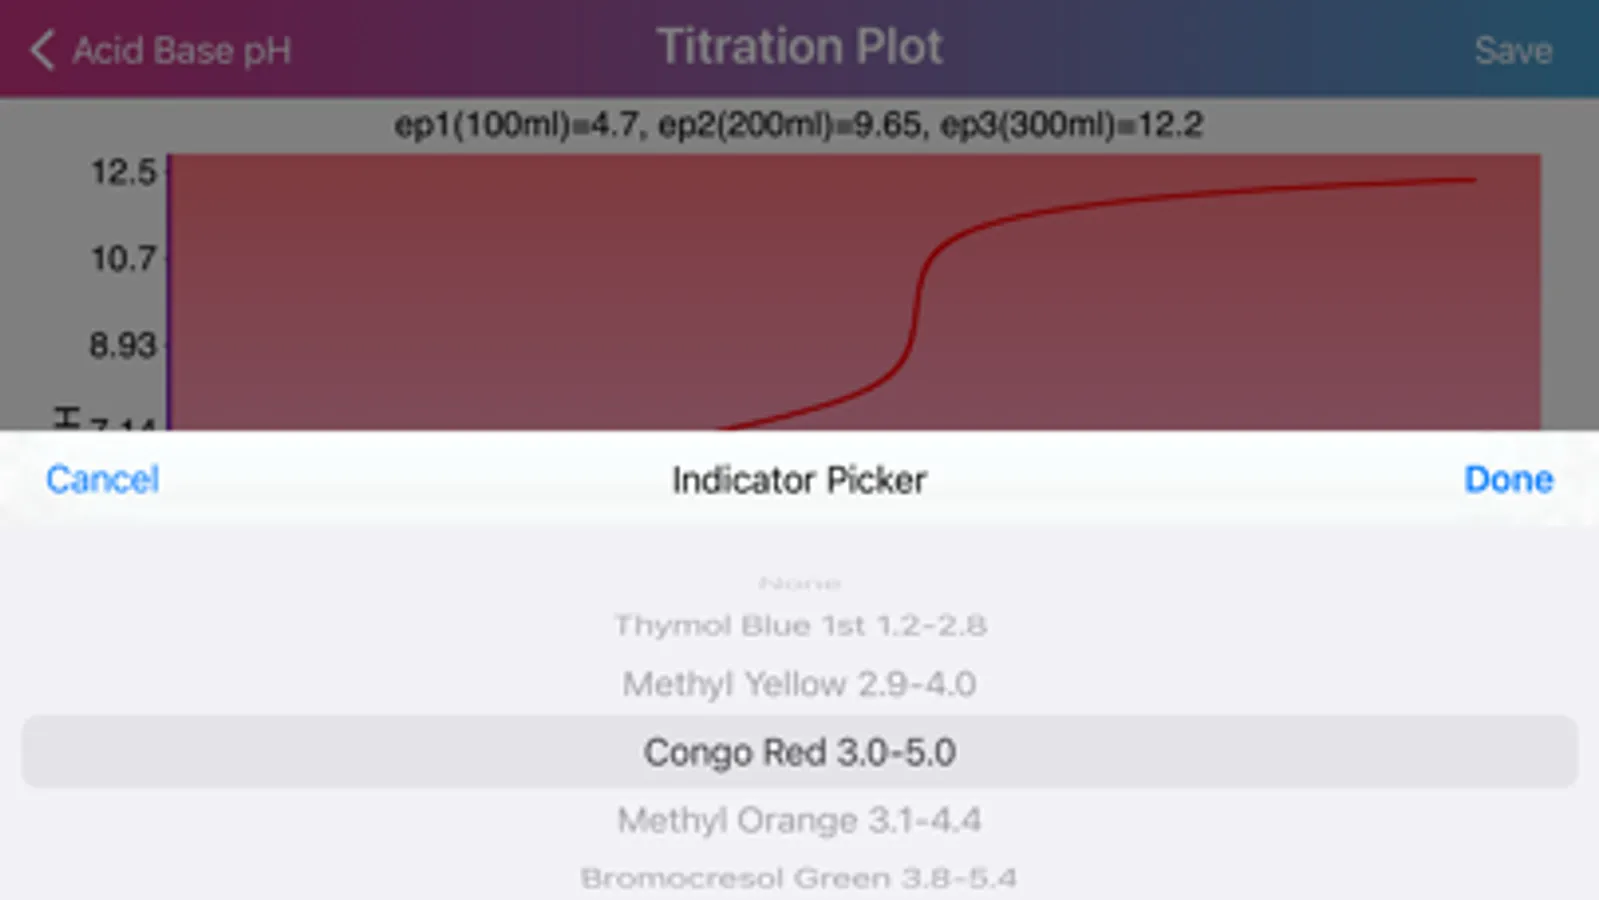
· Application provides list of commonly used indicators and presents color transformations on top of titration curve.
Important points.
·The user must provide both initial molar concentrations of acid and base in order to get the titration curve plotted.
·To get the specific pH value of the mixture, the user must provide initial volumes of acid and base solutions, otherwise pH at equimolar point will be estimated!
·If user updates any of the required data, the program will not start to plot titration curve until user press “Calculate” button and only if the update is accepted.
·Equivalent point is represented by particularly big jump in pH at almost no change in volume, making impractical any precise titrant volume estimation in the close proximity to the point.
·Initial concentrations of acid or base must be above 0.5 µM.
·Info for equivalent points is provided on the base of molar ratios only!
·Application assigns dot as a decimal separator.
