
AppRecs review analysis
AppRecs rating 2.3. Trustworthiness 65 out of 100. Review manipulation risk 23 out of 100. Based on a review sample analyzed.
★★☆☆☆
2.3
AppRecs Rating
Ratings breakdown
5 star
0%
4 star
0%
3 star
0%
2 star
0%
1 star
100%
What to know
✓
Low review manipulation risk
23% review manipulation risk
⚠
Mixed user feedback
Average 2.3★ rating suggests room for improvement
About Smart Water Tech
Smart Water Tech Screenshots

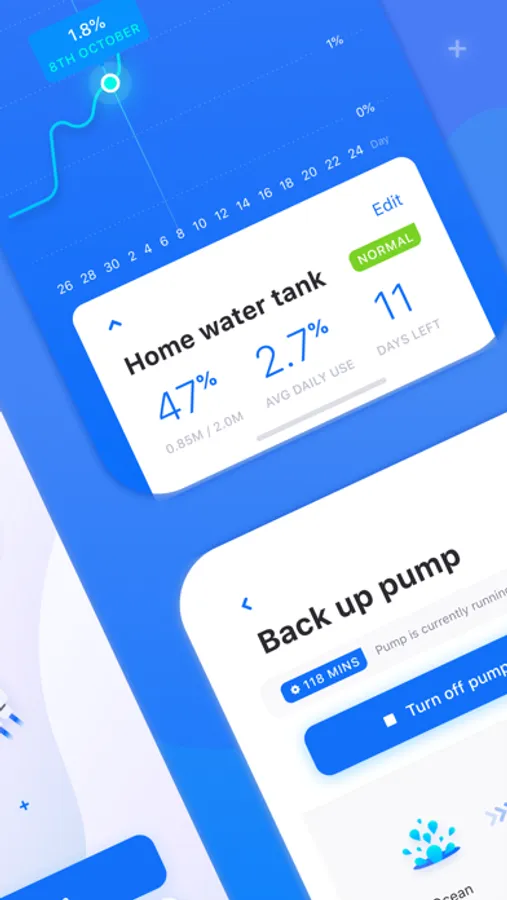
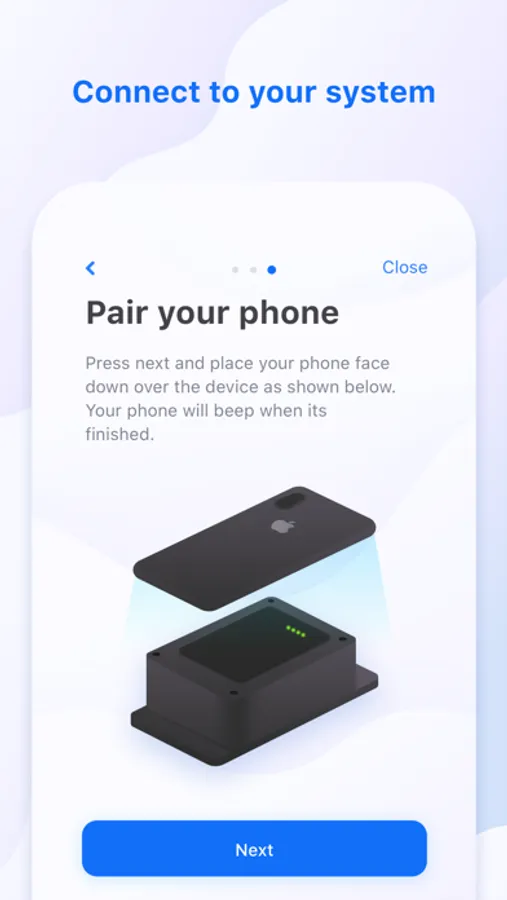
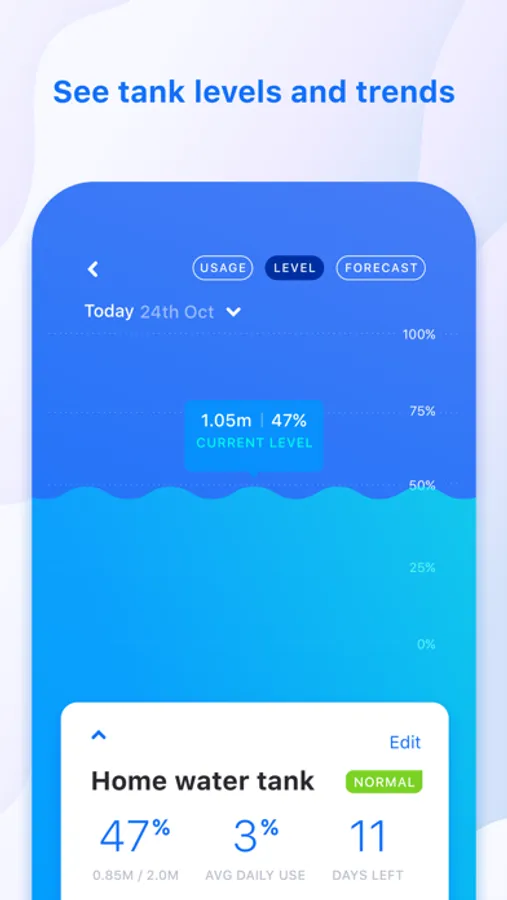
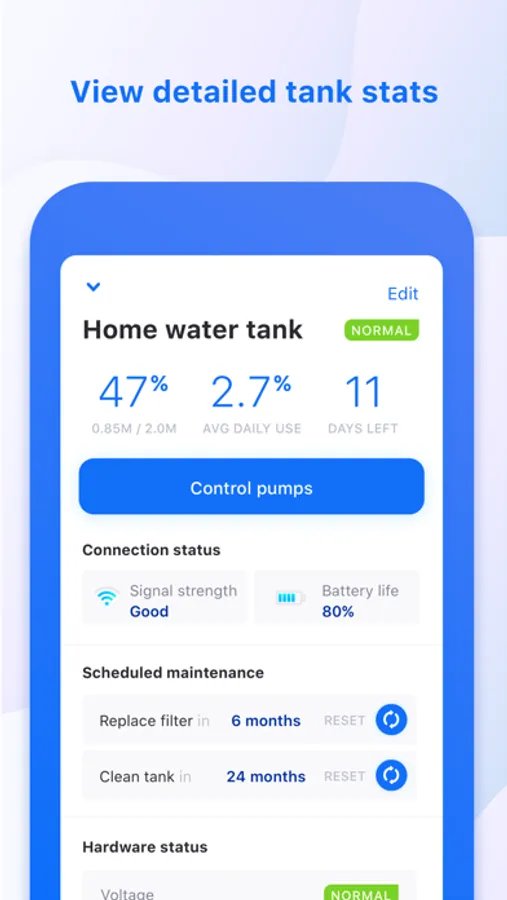
Tap to Rate:
Reviews for Smart Water Tech
Duncan in SV
Hardware is good; app is pretty bad
Update six months after writing the review below: None of the bugs (serious or minor) have been addressed so I’m downgrading the app review. The hardware has been great. However, the app does not work as advertised and the developers are unresponsive. If you just want to know the tank level by checking manually, it works, but the other advertised features simply aren’t there. I don’t like saying this, but the in-app subscription supposedly enabling these features doesn’t do that, so the payment is a ripoff. Can’t recommend the subscription; unfortunately people buying the hardware may not find this out until too late. Original review from November 29 2021 below. The monitor is great; I no longer have to visit the water tanks in person to check. That said, the app looks okay but functionality and interface need improvement. I’ve helped a neighbor install one as well but I’d like to be able to give a stronger recommendation. (Normally I send feedback directly to the developer vs. posting a review, but I emailed them a few months ago, offering to help with logs or installing beta app versions and never heard back.) My biggest problem: The app lets you define some alert conditions, which is what I expected after reading the product description on the web, but the app doesn’t send push notifications when an alert is triggered: you must launch the app to discover whether an alert condition exists. I’ve gotten into the habit of checking the app daily, which is not the point: it should be “set and forget.” Another significant problem is that the usage stats have never appeared, even after several months of use. This means that the usage forecast is meaningless. Average daily use has always displayed as zero. Other improvements that would benefit customers: Trending data lacks sufficient granularity. I want to see the day’s use since this would help me spot excess outflow caused by leaks in an irrigation line. A week view would also be helpful; just having a month view is interesting but not terribly useful. The ability to export the data to a spreadsheet would be helpful so I could have longer-term data. Ideally this would be automated somehow, but manually would be a good start.