AppRecs review analysis
AppRecs rating 3.5. Trustworthiness 74 out of 100. Review manipulation risk 16 out of 100. Based on a review sample analyzed.
★★★☆☆
3.5
AppRecs Rating
Ratings breakdown
5 star
50%
4 star
0%
3 star
0%
2 star
50%
1 star
0%
What to know
✓
Low review manipulation risk
16% review manipulation risk
✓
Credible reviews
74% trustworthiness score from analyzed reviews
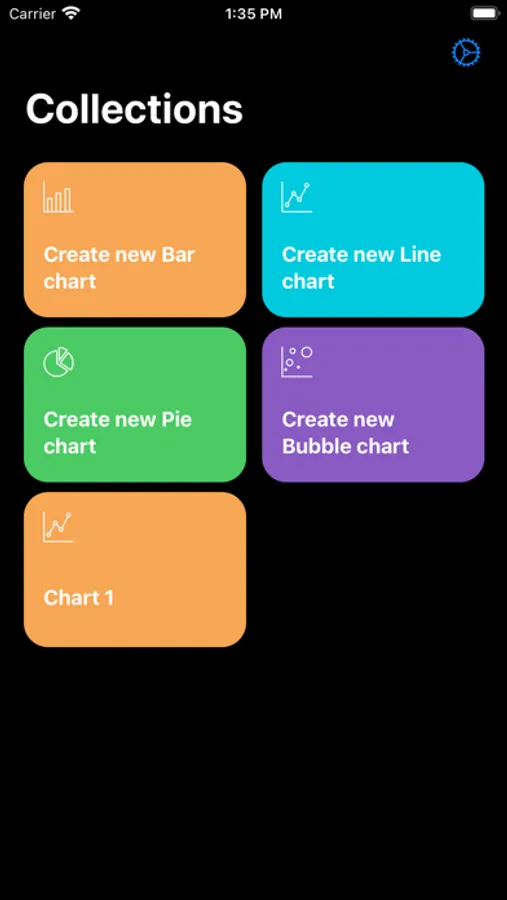
About The Data Visualizer
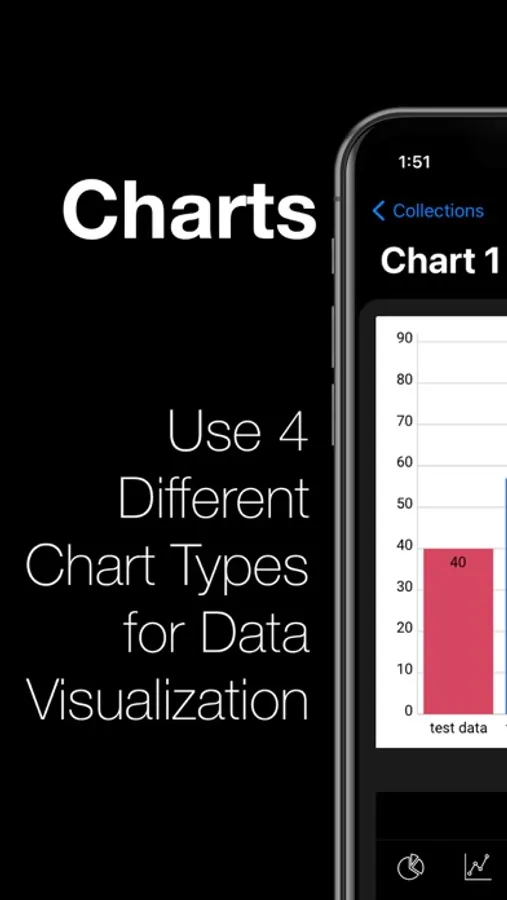
Visualizer allows you to create graphics in a new way.
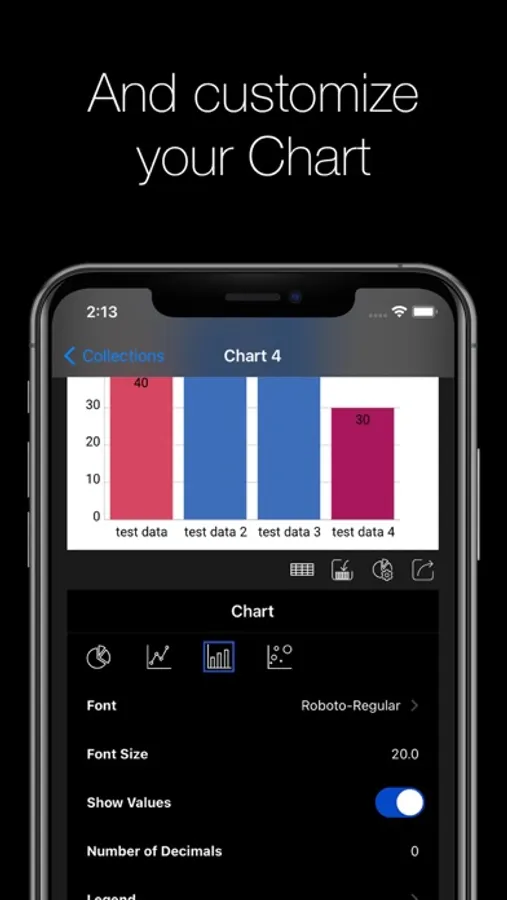
By selecting one of the different options in the overview, you can create easy and awesome looking charts.
You can now add the created chart as a widget to your homescreen.
Visualizer support all kind of charts:
- bar charts,
- pie charts,
- line charts
- bubble charts
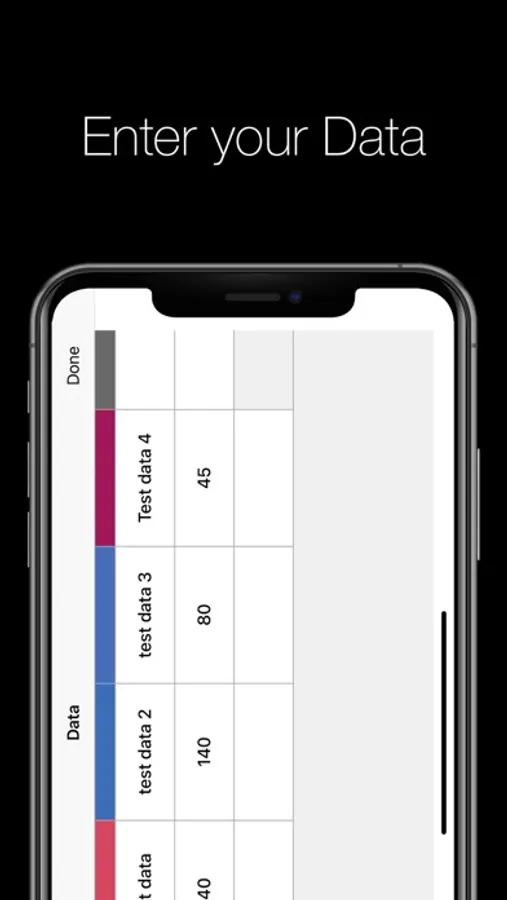
all of them can be easily edited with the build in spreadsheet.
You can use a CSV file to add a data set.
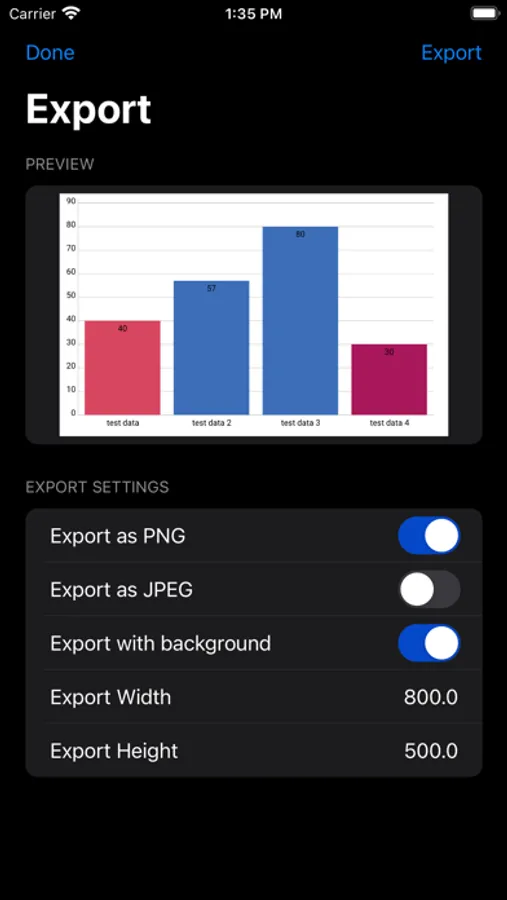
All charts you create can be exported as JPG or PNG.
Infographer allows to create data visualizations.
This is a pure native app, so all app functionalities are performant and can be used offline.
By selecting one of the different options in the overview, you can create easy and awesome looking charts.
You can now add the created chart as a widget to your homescreen.
Visualizer support all kind of charts:
- bar charts,
- pie charts,
- line charts
- bubble charts
all of them can be easily edited with the build in spreadsheet.
You can use a CSV file to add a data set.
All charts you create can be exported as JPG or PNG.
Infographer allows to create data visualizations.
This is a pure native app, so all app functionalities are performant and can be used offline.
The Data Visualizer Screenshots

Tap to Rate:
Reviews for The Data Visualizer
Andrew Shapner
Support
Hello, I am very fond of the visualizer app. It’s been very useful. I am wondering if there is a way to recover deleted graphs. One of my graphs with a lot of data got deleted and I’m not sure how it happened. I probably accidentally did it in my pocket.
铁乘机的很难
can only select one column as y axis
for most time i need show multi column as y axis