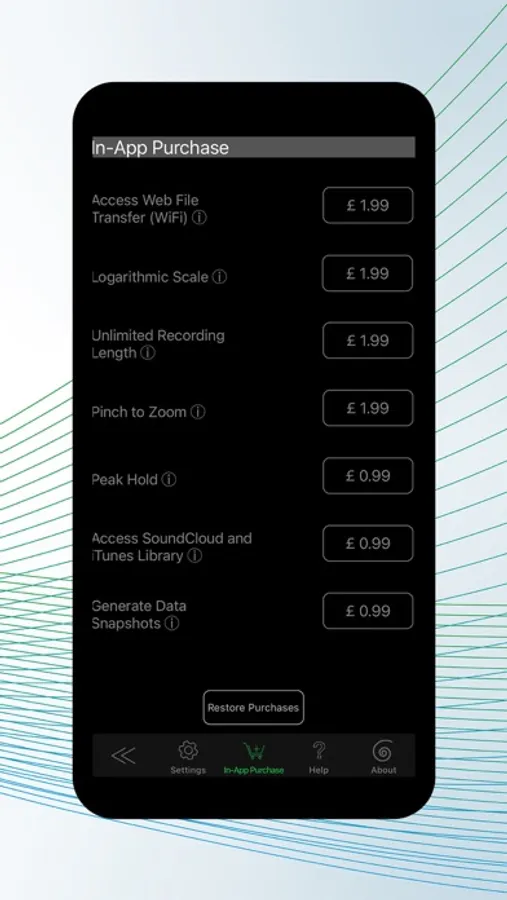
In this audio analysis app, you can visualize real-time frequency spectra and create custom measurements with adjustable scales. Includes options for saving recordings, generating snapshots, and transferring files via web browser.
AppRecs review analysis
AppRecs rating 2.8. Trustworthiness 80 out of 100. Review manipulation risk 21 out of 100. Based on a review sample analyzed.
★★☆☆☆
2.8
AppRecs Rating
Ratings breakdown
5 star
39%
4 star
11%
3 star
7%
2 star
9%
1 star
34%
What to know
✓
Low review manipulation risk
21% review manipulation risk
⚠
Pricing complaints
Many low ratings mention paywalls or pricing
⚠
High negative review ratio
43% of sampled ratings are 1–2 stars
About SpectrumView
SPECTRUMVIEW
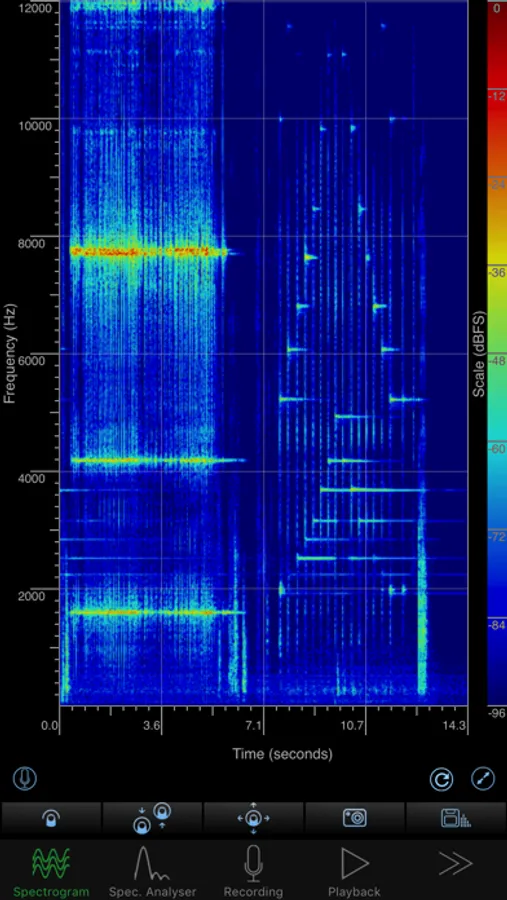
Visualise, in real time, the frequencies that you can hear around you and even those you cannot with SpectrumView, your dynamic audio companion for iPhone, iPad, and iPod Touch.
SpectrumView provides a high-quality, real-time spectrogram and spectrum analyser display, with a configurable sample rate and frequency resolution. You can use this application to measure the highest tones you can sing, obtain visual feedback of the frequencies in your speech, identify an annoying sound, calibrate musical instruments and all sorts of acoustic analysis.
Here's what it can do for you:
· Refresh Spectrogram. Allows users to refresh the spectrogram so that it clears the spectrogram that had already been displayed.
· Change min and max scale. Allows users to set their own minimum and maximum scale value on the spectrogram and spectrum analyser view, in both linear and log scale.
· Set Recording filename. Recording filenames are editable and the suffix can be set to have an incremental value or date/time.
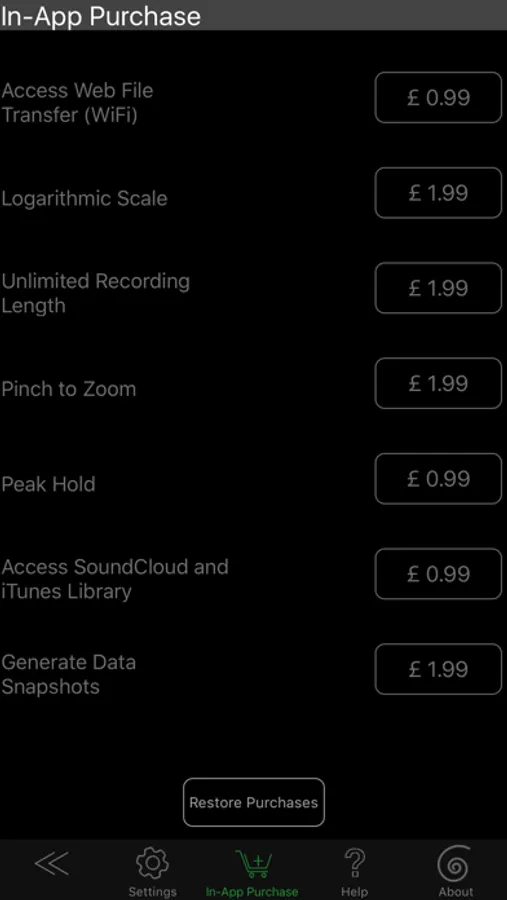
· Generate snapshot of the spectrum data from playback and live recordings. [IAP]
· Access recordings and snapshots using the "Files" app. All the data can be easily accessible using the "Files" app that is available from iOS 11.
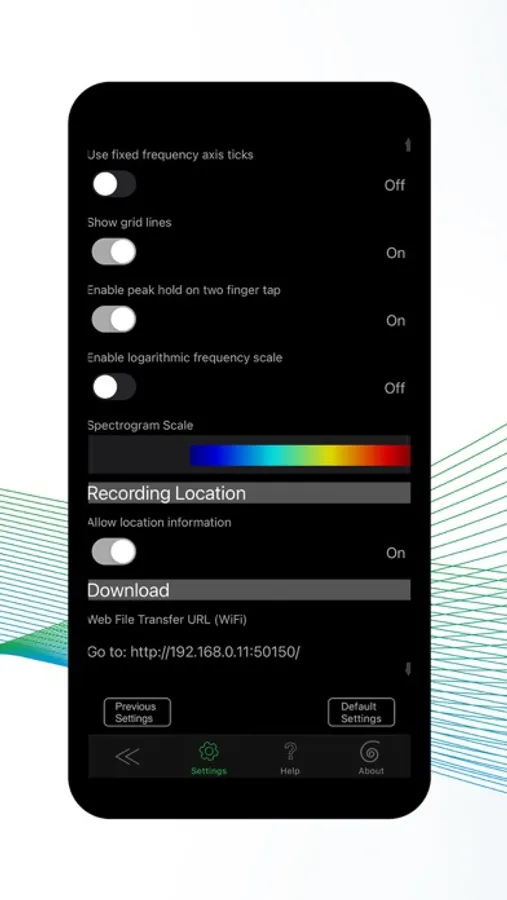
· Web File Transfer. Allows you to access your files from another device using a web browser. [IAP]
· Logarithmic scale. Allows you to set either linear or logarithmic frequency scales in the Spectrogram and Spectrum Analyser views. [IAP]
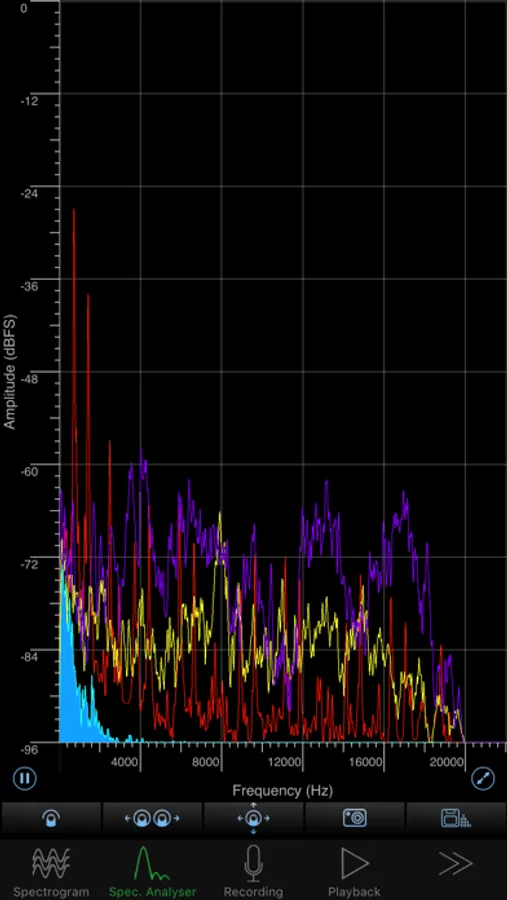
· Peak hold. Allows you to freeze and hold the peaks of the frequency envelope (three holds in three distinct colours) in Spectrum Analyser mode. [IAP]
· Save location. Never forget where a clip was recorded – uses the devices location services.
· Auto lock disabled. During playback and recordings auto lock is disabled to prevent the device from automatically locking (if enabled), for uninterrupted recording/playback
· Multiple selectable sample rates from 8,000 Hz to 48,000 Hz
· High-frequency resolution with configurable signal analysis window lengths or Fast Fourier Transform (FFT) orders.
· Sound intensity represented using a colour spectrum scale from -96 dBFS to 0 dBFS.
· Frequency Pinch-to-Zoom. Allows you to zoom into the frequency space to look at a specific tone or frequency. [IAP]
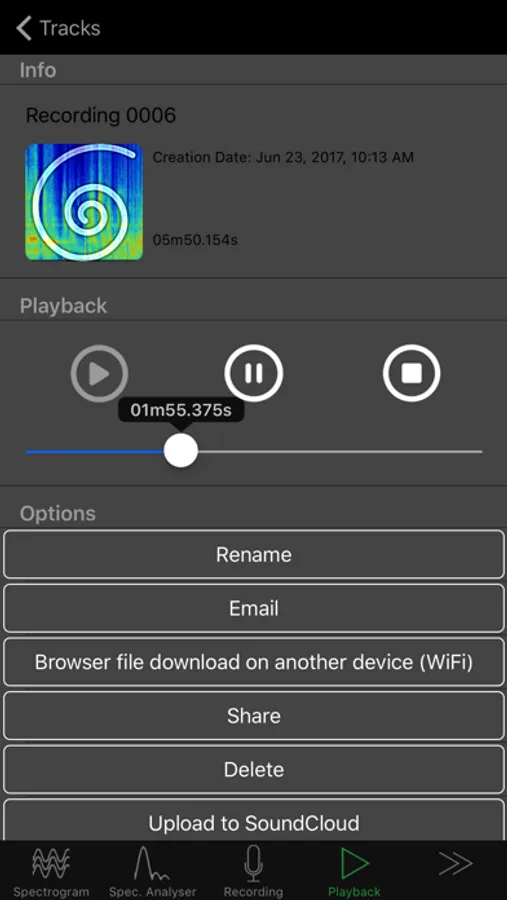
· Recording and Playback of Audio Files. Provides a fully functional audio recorder that allows you to record, pause and play back files in high-quality, uncompressed, wave format.
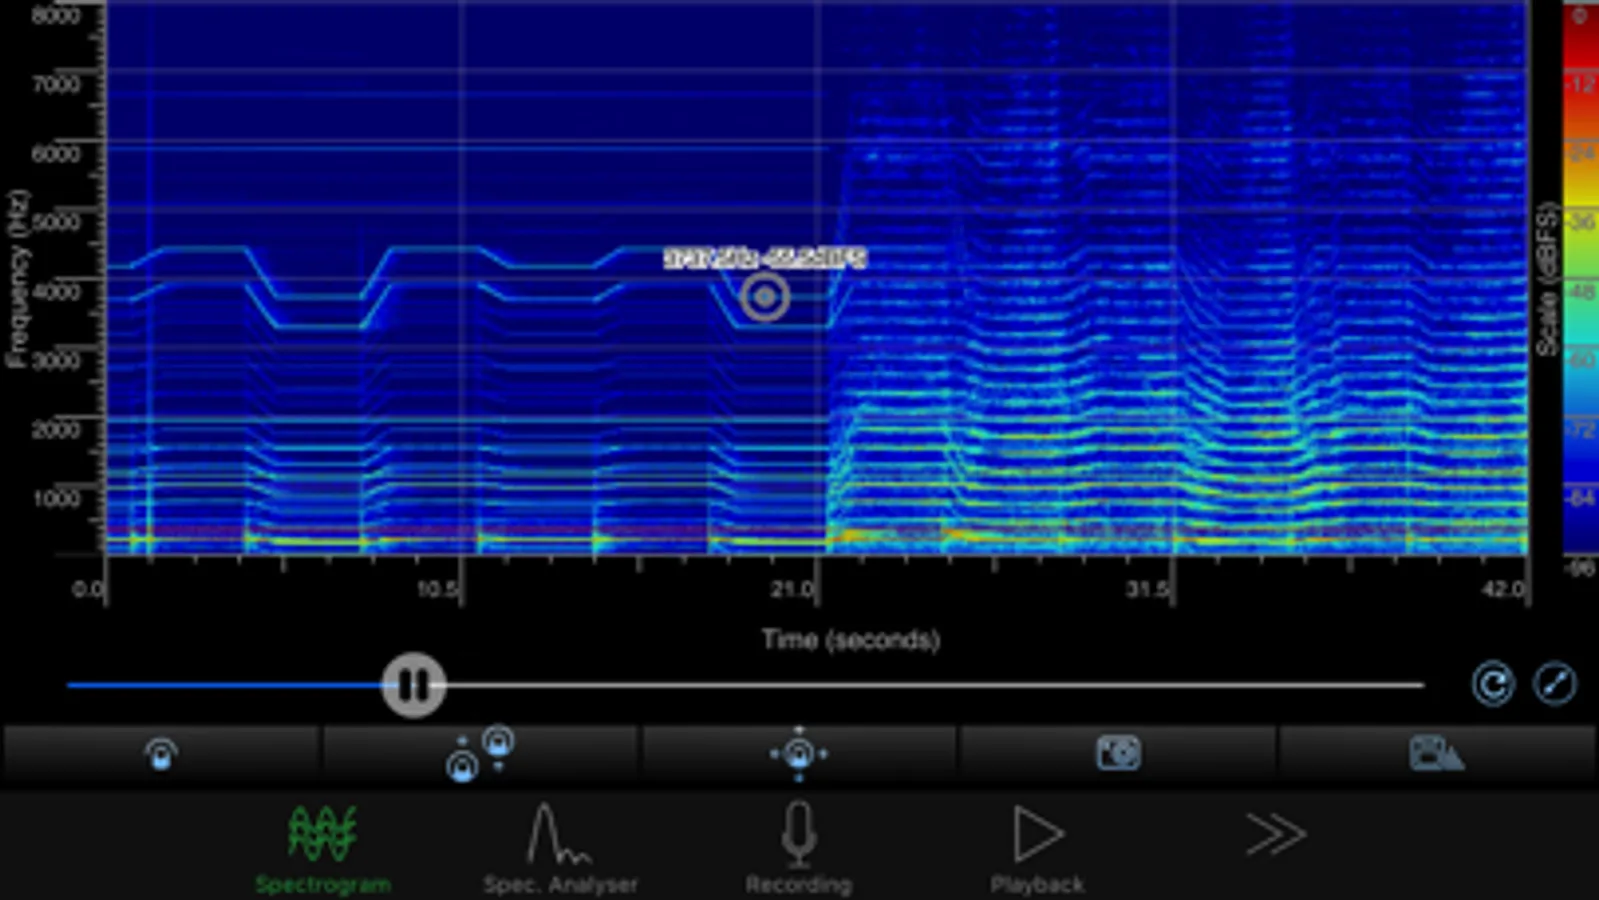
· Tap Data Cursor. Allows taps on any part of the Spectrogram or Spectrum Analyser display to obtain the exact frequency in Hertz (Hz) and level in decibels (dB) at that point.
· Musical Notes or Frequency Display on Tap. Selectable frequency or musical pitch notation to obtain the cent-accurate musical note e.g. A4 (22), when the display is tapped.
· Live Spectrogram and Spectrum Analyser Views of Recorded Files. Files recorded can be played back and the Spectrogram and Spectrum Analyser modes can be used to review the audio.
· Sharing Recorded Files by Email or iTunes File-sharing.
· High Quality Screenshots.
· *Improved* Soundcloud support. Audio files can be uploaded to or downloaded from Soundcloud as well as being able to post audio to Facebook. [IAP]
· Playback from iTunes library. Files can now be analysed directly form the iTunes library.
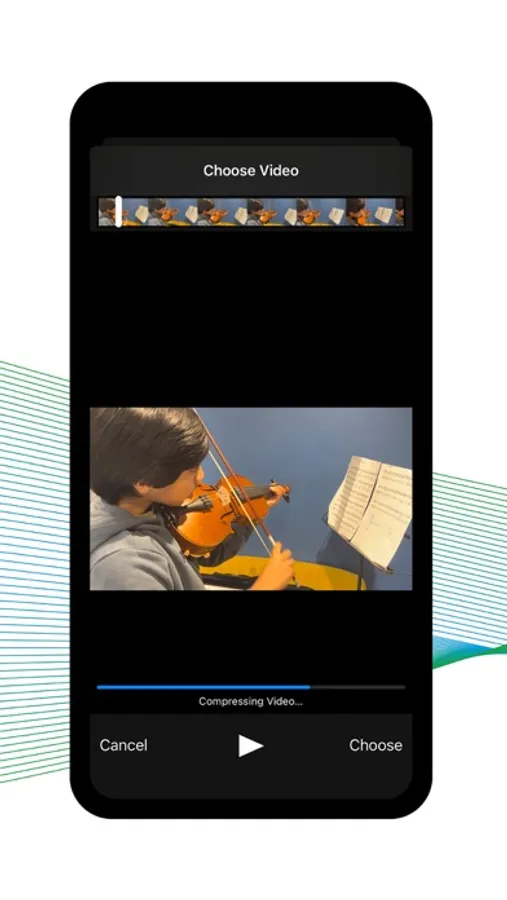
· *NEW* Import audio from videos in your device library.
· Fullscreen mode. Hide the menu at the bottom of the screen to get even more of the screen dedicated to frequency analysis.
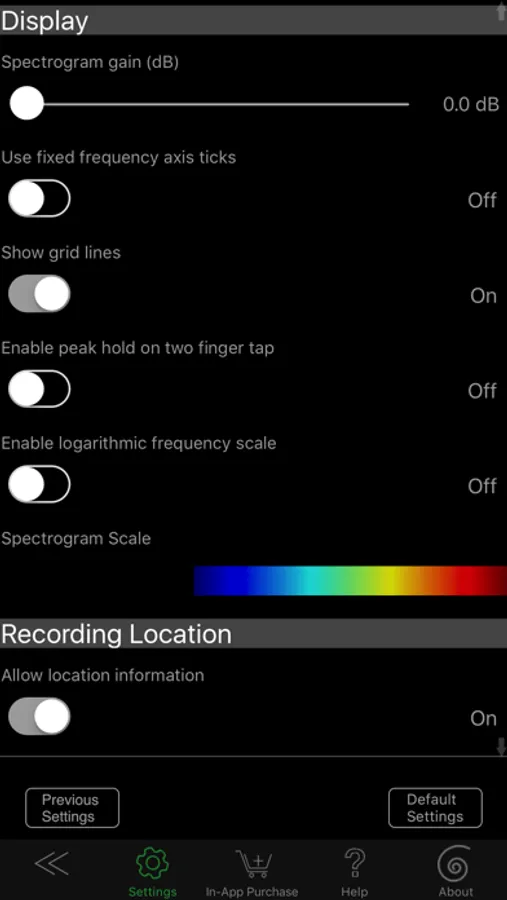
· Selectable spectrogram colour scales. You can now select one of 7 colour scales for your spectrogram.
· Selectable window functions. You can now see the window function options provided.
· Apply gain. A maximum of 24dB gain can be applied to make ‘hard to see’ details easier to view.
· Open In. Audio files can be directly opened in SpectrumView. View files sent by email directly in SpectrumView.
