About Spotlight Cloud
Users of Spotlight on Oracle and Spotlight on SQL Server Enterprise can now monitor their environment remotely using the Spotlight Mobile Application.
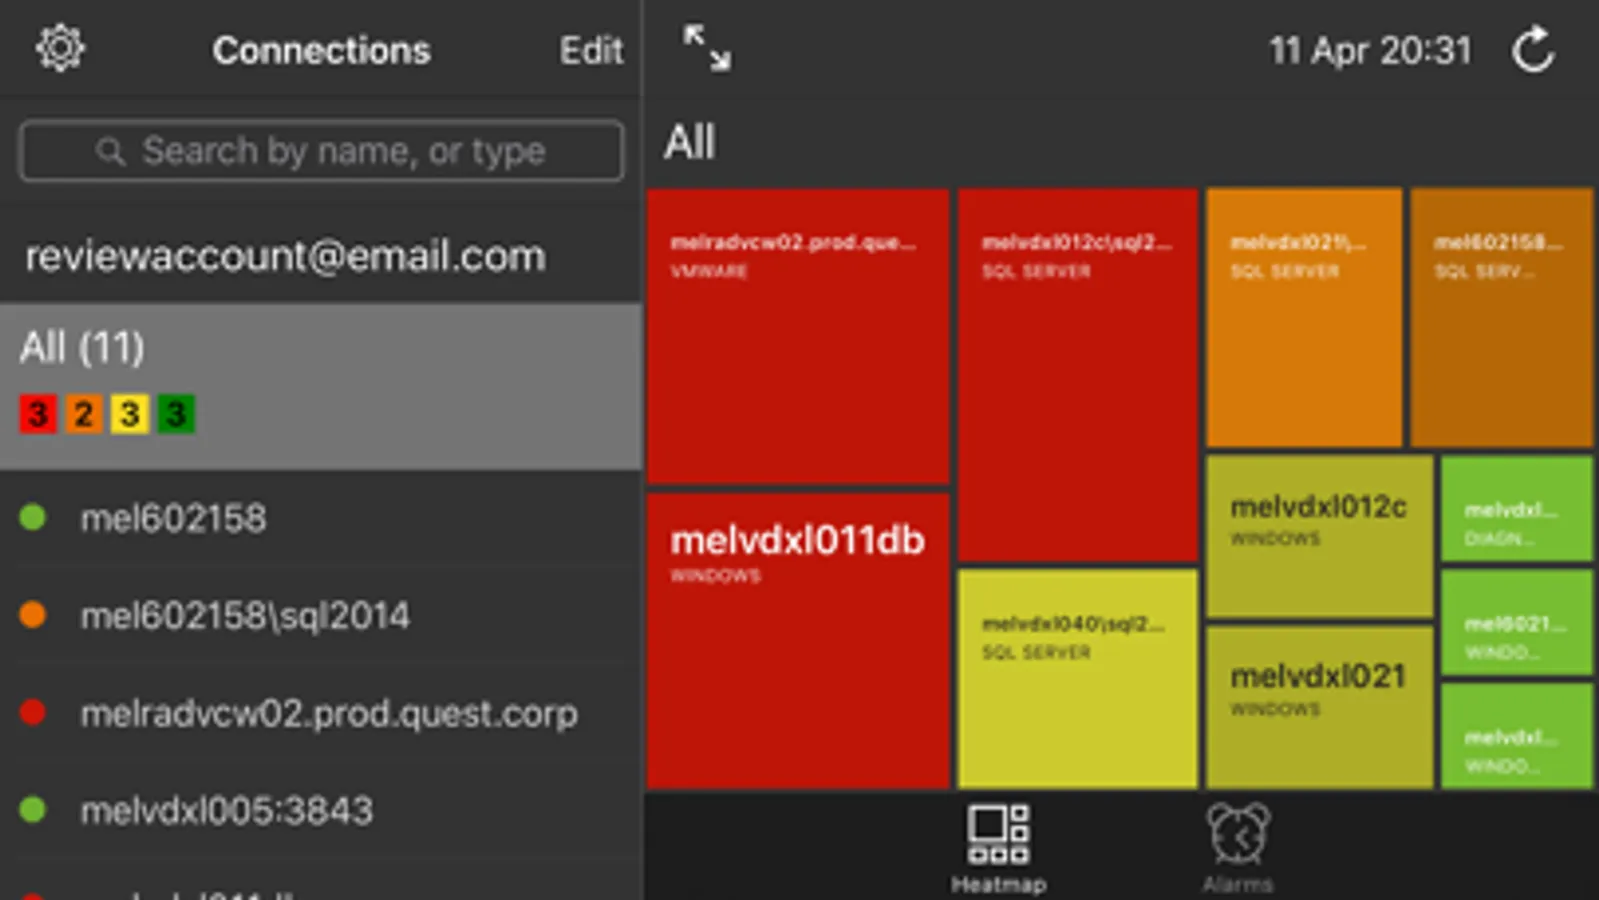
The Heatmap provides ‘at-a-glance’ visualization of servers needing immediate attention. Size, position and color of a heat map cell instantly communicates the severity and description of alarms raised on that server.
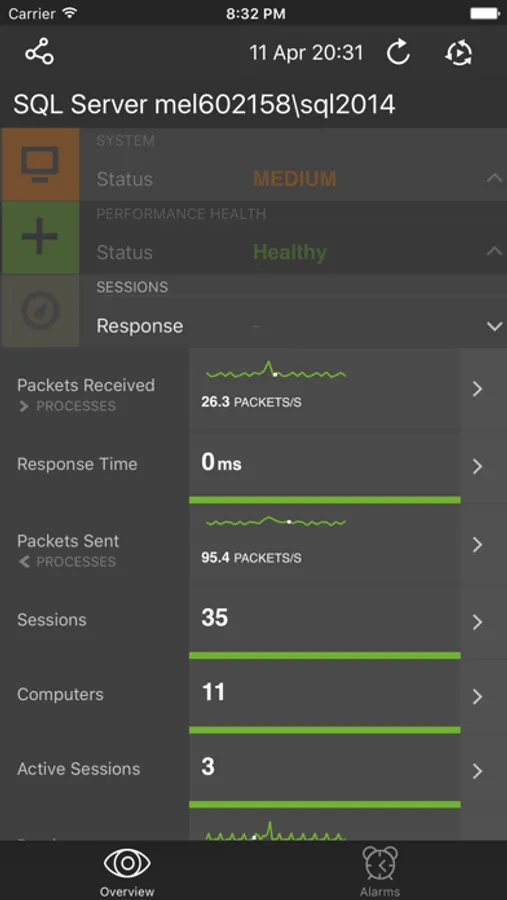
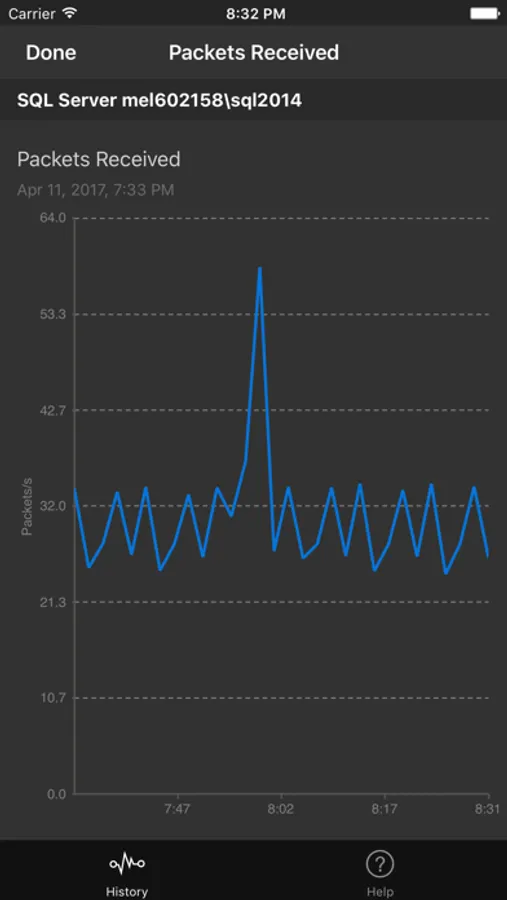
For Spotlight on SQL Server users, new performance diagnostics are included in this release that are modelled on the Spotlight on SQL Server Enterprise homepage. Use this new feature to follow indicators relating to your System, Performance Health, Sessions, Processes, Memory, Background Processes and Disk Storage to the problem source.
• Custom Views allow grouping of servers into logical entities (For example: "Production" or "Test" environments).
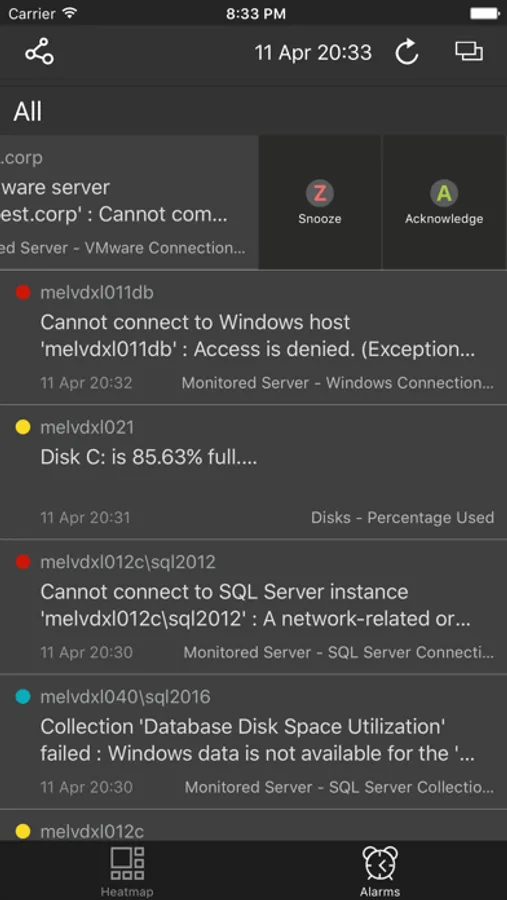
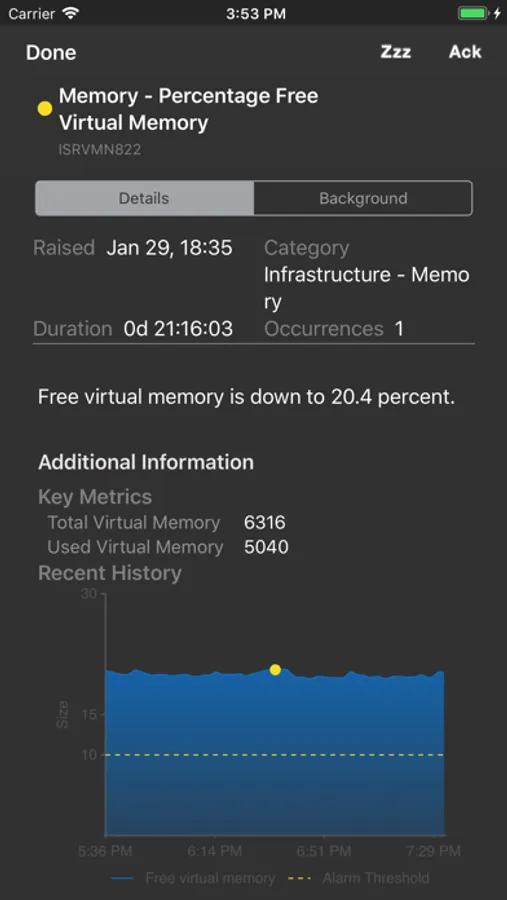
• Alarm lists can be shown ungrouped or grouped by severity, server or alarm type, and sorted by date or severity.
Features of Spotlight include:
- Colors, alarm types and severity consistent with those on Spotlight
- Cell-like heat map that provides instant awareness of server status through color, position and sizing.
- Simple tap navigation through from heat map cell to connection overview.
- Alarm lists that can be optionally grouped by server, severity or alarm, and sorted by date or severity.
- Alarm Snoozing and Alarm Acknowledgement right from the device.
- Multiple Spotlight accounts can be added (and logged into) via the settings area on the device.
- Playback support, allowing for connections to be shown as they were when alarm events were raised.
IMPORTANT - The Spotlight Mobile app requires Spotlight Cloud, Spotlight on SQL Server Enterprise or Spotlight on Oracle to be installed in your environment to work.
Spotlight Cloud Screenshots
Tap to Rate:
