In this health tracking app, you can monitor your basal body temperature and detect ovulation automatically. Includes cycle analysis, trend insights, and visual summaries of your hormonal patterns.
AppRecs review analysis
AppRecs rating 2.9. Trustworthiness 80 out of 100. Review manipulation risk 22 out of 100. Based on a review sample analyzed.
★★☆☆☆
2.9
AppRecs Rating
Ratings breakdown
5 star
50%
4 star
7%
3 star
4%
2 star
5%
1 star
35%
What to know
✓
Low review manipulation risk
22% review manipulation risk
⚠
Pricing complaints
Many low ratings mention paywalls or pricing
⚠
High negative review ratio
40% of sampled ratings are 1–2 stars
About Wrist Temperature Tracker
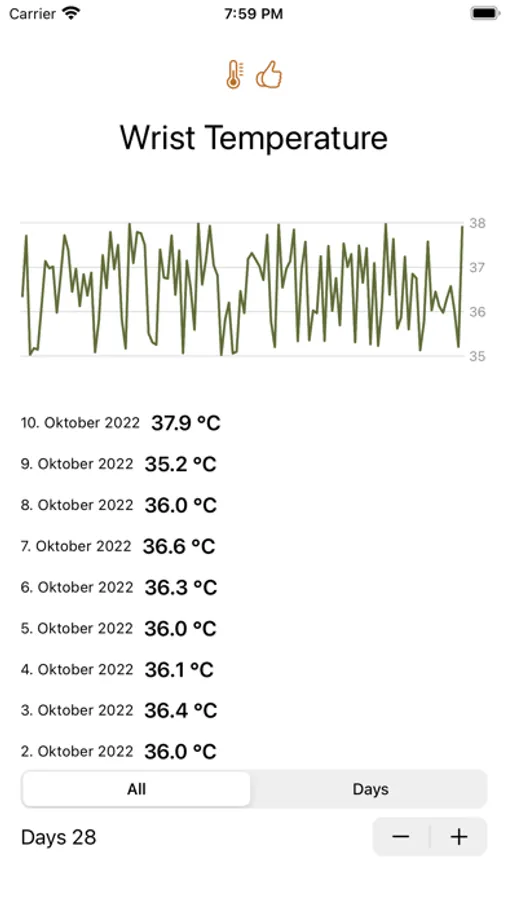
Cycle Insight – Automatic Cycle Analysis with Basal Body Temperature
Cycle Insight detects your cycle, ovulation, and temperature patterns automatically based on your daily Apple Watch measurements. No manual charting, no guesswork—your temperature curve is analyzed intelligently so every phase of your cycle is visible at a glance.
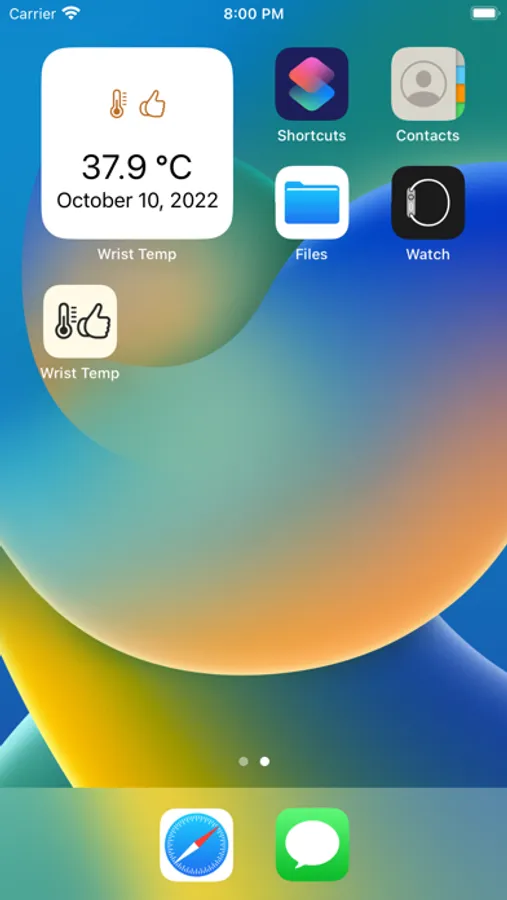
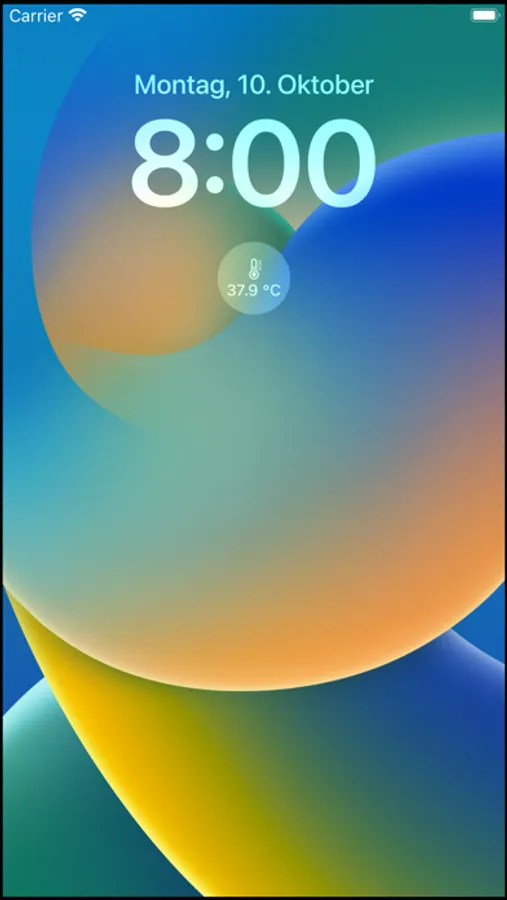
Some features (cycle overlays, widgets, yearly trends) require an in-app purchase.
Core Features
- Automatic detection: Pinpoints ovulation, thermal shifts, and cycle length without manual calculations.
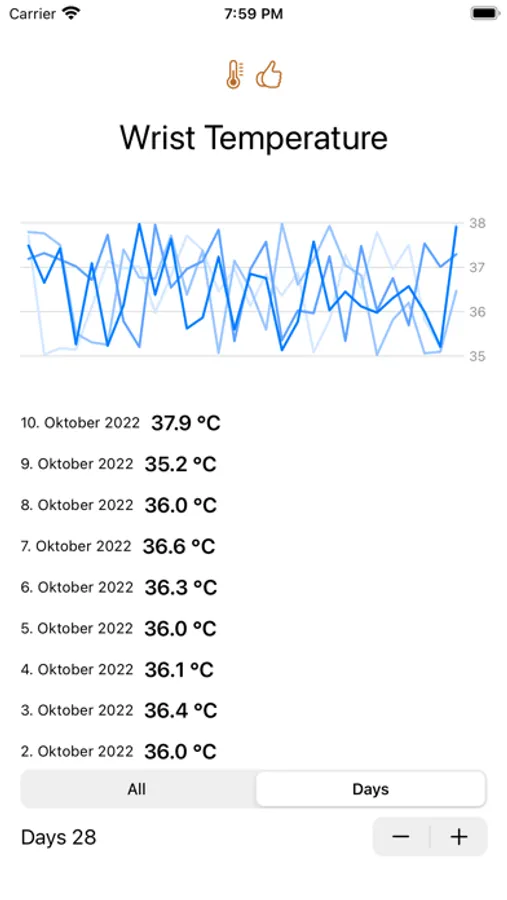
- Cycle comparison: Overlay multiple cycles to spot recurring patterns or changes.
- Cycle overview: Each cycle stores start date, length, and ovulation day with indicators for long or unusual phases.
- Trend insights: Average cycle length, temperature rise, follicular and luteal phases are calculated for you.
- Flexible alignment: Choose whether curves line up by cycle day or ovulation day.
- Precision analysis: Detects fever spikes and luteal stability, flagging outliers automatically.
Monthly Focus
- Every day appears as a tile in a mini calendar with heat-map colors for deviations plus a tooltip showing value and status.
- A compact trend line highlights how the month evolves and surfaces ranges worth watching.
- Dropdowns, a quick scroller, and keyboard arrows let you jump to previous or next months instantly.
Weekly & Trend Pane
- Tapping a day opens a detail pane with the surrounding week, including a seven-point line and guardrails.
- Optional tags such as Fever or Training appear as chips beneath the week so recurring triggers stay visible.
Yearly Overview
- Twelve mini sparklines or heat-map rows surface year-long trends in seconds.
- Highlight ranges call out unusual phases above your personal threshold and add aggregates like average and peak temperature.
- Scroll the timeline or jump directly to a year to review seasons without losing context.
Interaction
- Soft transitions keep you in flow—no hard reloads when switching months or years.
- Contextual tooltips explain shifts, for example “+0.6 °C above your baseline.”
- Filters and legends clarify measurement status such as missed or manual entries; on mobile you swipe between months and stack weekly cards.
Terms and conditions: https://www.apple.com/legal/internet-services/itunes/dev/stdeula/
Cycle Insight detects your cycle, ovulation, and temperature patterns automatically based on your daily Apple Watch measurements. No manual charting, no guesswork—your temperature curve is analyzed intelligently so every phase of your cycle is visible at a glance.
Some features (cycle overlays, widgets, yearly trends) require an in-app purchase.
Core Features
- Automatic detection: Pinpoints ovulation, thermal shifts, and cycle length without manual calculations.
- Cycle comparison: Overlay multiple cycles to spot recurring patterns or changes.
- Cycle overview: Each cycle stores start date, length, and ovulation day with indicators for long or unusual phases.
- Trend insights: Average cycle length, temperature rise, follicular and luteal phases are calculated for you.
- Flexible alignment: Choose whether curves line up by cycle day or ovulation day.
- Precision analysis: Detects fever spikes and luteal stability, flagging outliers automatically.
Monthly Focus
- Every day appears as a tile in a mini calendar with heat-map colors for deviations plus a tooltip showing value and status.
- A compact trend line highlights how the month evolves and surfaces ranges worth watching.
- Dropdowns, a quick scroller, and keyboard arrows let you jump to previous or next months instantly.
Weekly & Trend Pane
- Tapping a day opens a detail pane with the surrounding week, including a seven-point line and guardrails.
- Optional tags such as Fever or Training appear as chips beneath the week so recurring triggers stay visible.
Yearly Overview
- Twelve mini sparklines or heat-map rows surface year-long trends in seconds.
- Highlight ranges call out unusual phases above your personal threshold and add aggregates like average and peak temperature.
- Scroll the timeline or jump directly to a year to review seasons without losing context.
Interaction
- Soft transitions keep you in flow—no hard reloads when switching months or years.
- Contextual tooltips explain shifts, for example “+0.6 °C above your baseline.”
- Filters and legends clarify measurement status such as missed or manual entries; on mobile you swipe between months and stack weekly cards.
Terms and conditions: https://www.apple.com/legal/internet-services/itunes/dev/stdeula/
Wrist Temperature Tracker Screenshots
Tap to Rate:
Reviews for Wrist Temperature Tracker
Melp1978
Scam
When I went to pay the 1.99 it went through Apple Pay and thankfully it declined because they tried to charge me $54.change.
chkxgkxgkxgkxig
Requires me to restart watch ~ every 3 days
This app is not reliable. It stops working every 2 to 3 days. Only way to get it to work again is to restart my watch.