SpecStream Audio Spectrum Plot
HARDCODED JOY S.R.L.
3.8 ★
59 ratings
10,000+
downloads
Free
+ in-app
With this audio spectrum plotting app, you can capture microphone input and visualize the real-time frequency spectrum. Includes adjustable sample rate, FFT buffer size, and spectrum display settings.
AppRecs review analysis
AppRecs rating 3.8. Trustworthiness 72 out of 100. Review manipulation risk 33 out of 100. Based on a review sample analyzed.
★★★☆☆
3.8
AppRecs Rating
Ratings breakdown
5 star
53%
4 star
10%
3 star
10%
2 star
16%
1 star
10%
What to know
✓
Credible reviews
72% trustworthiness score from analyzed reviews
✓
Good user ratings
64% positive sampled reviews
✓
Authentic reviews
Natural distribution, no red flags
About SpecStream Audio Spectrum Plot
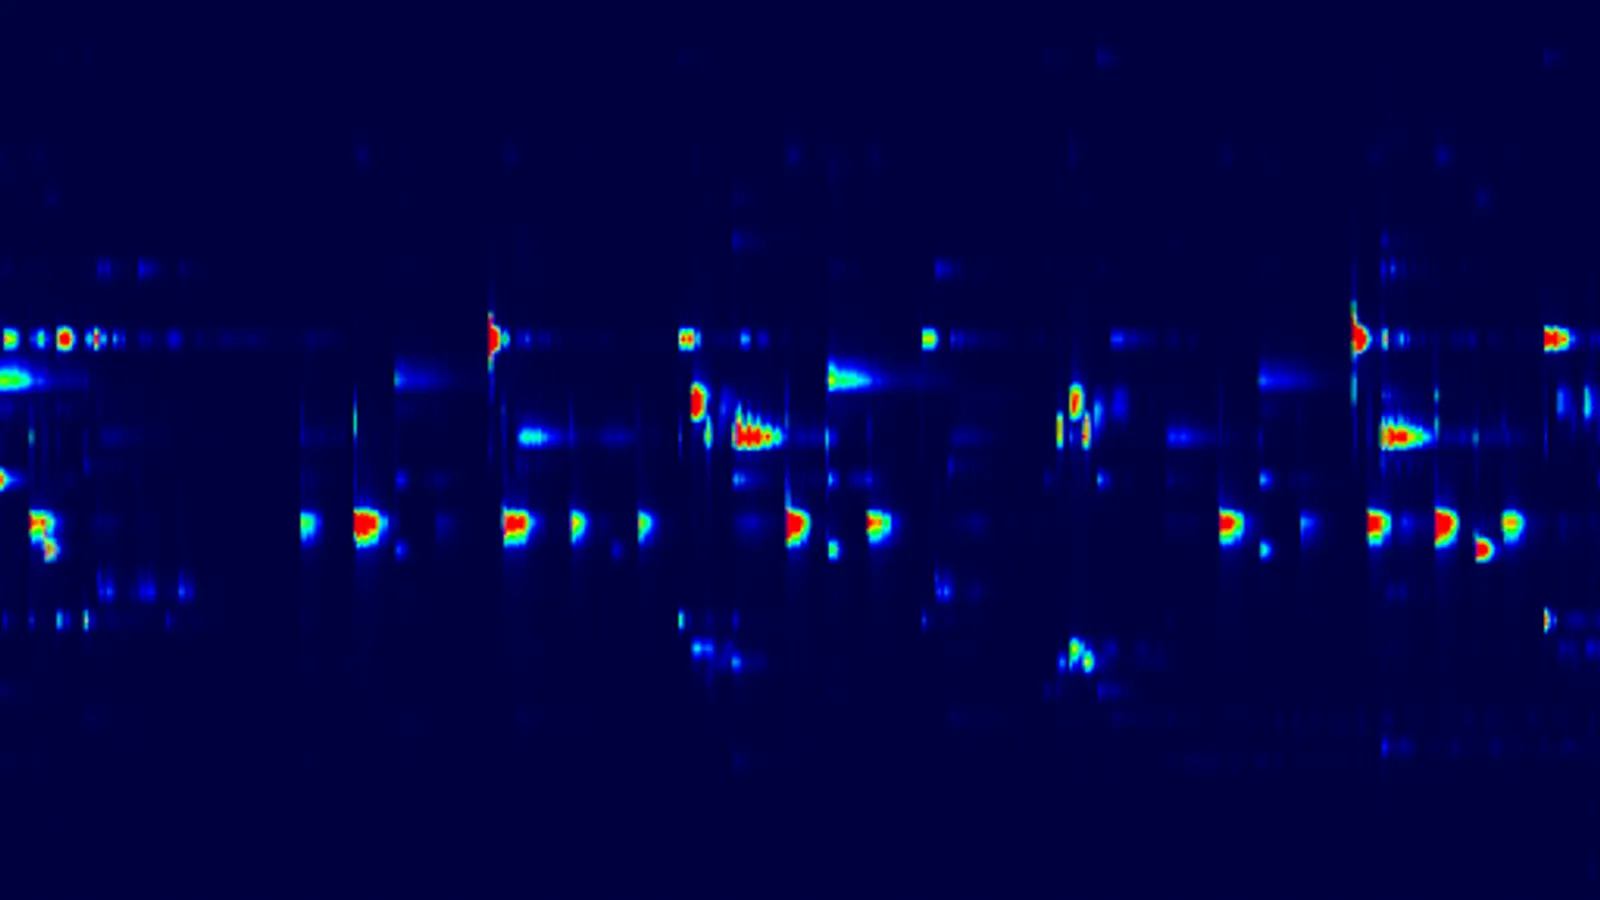
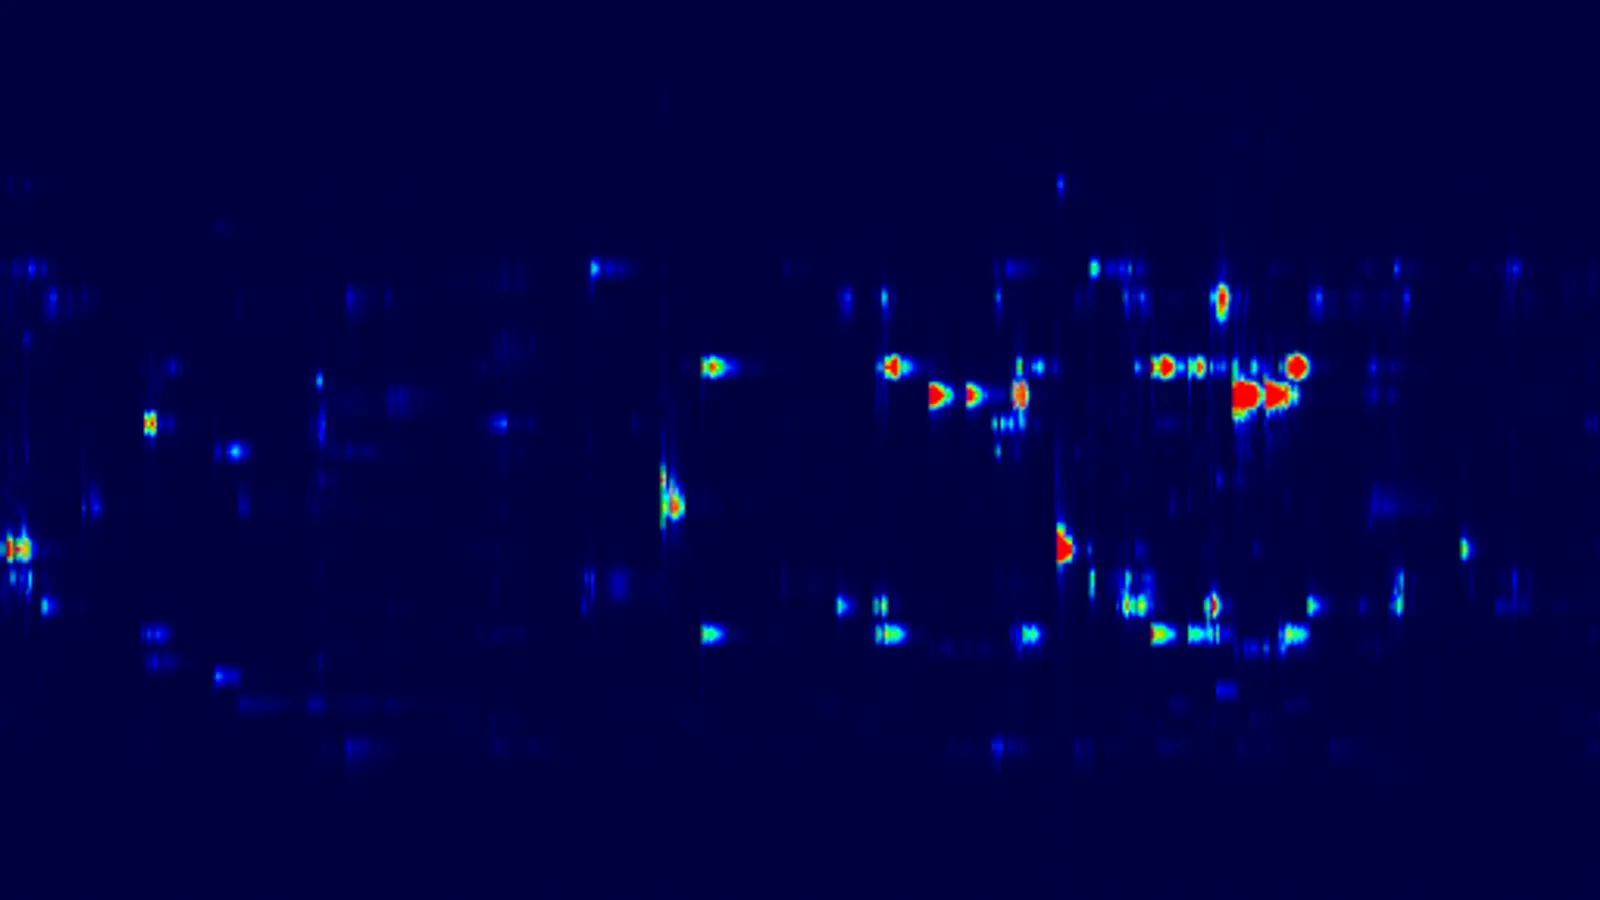
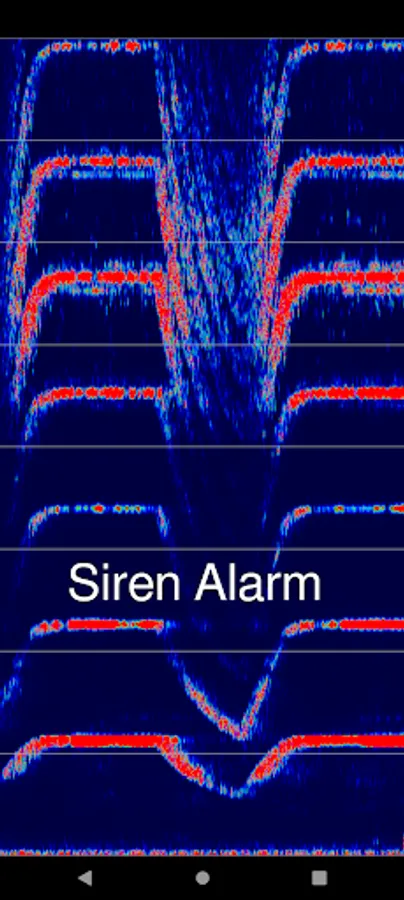
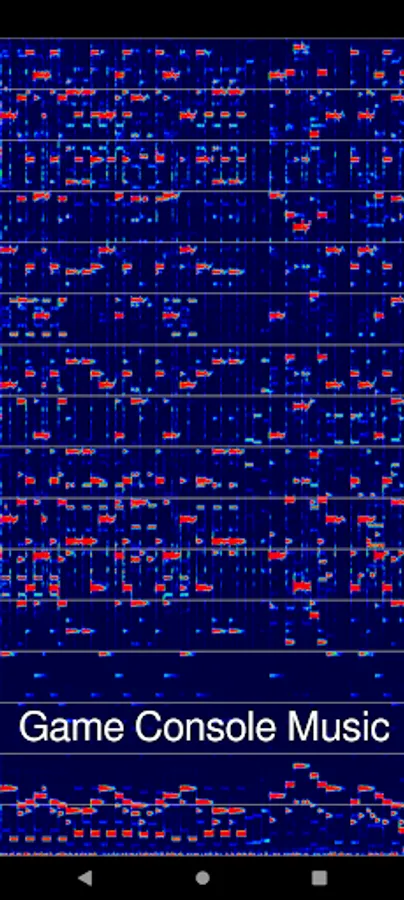
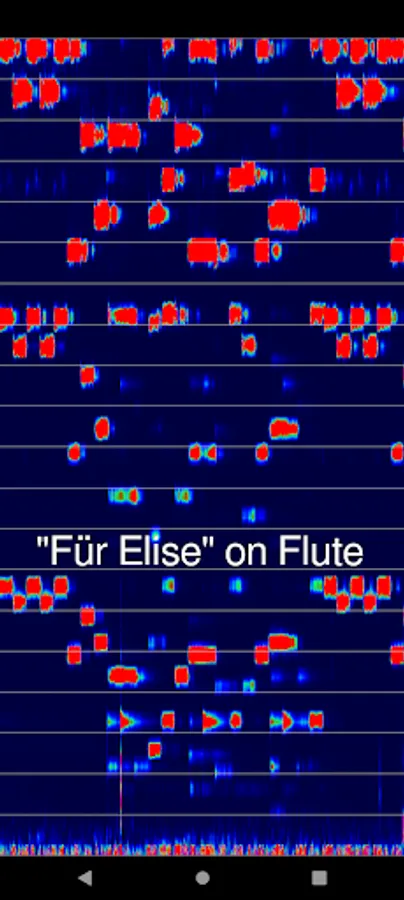
App gets audio data from microphone and plots the real time spectrum in the form of a scrolling image.
App settings:
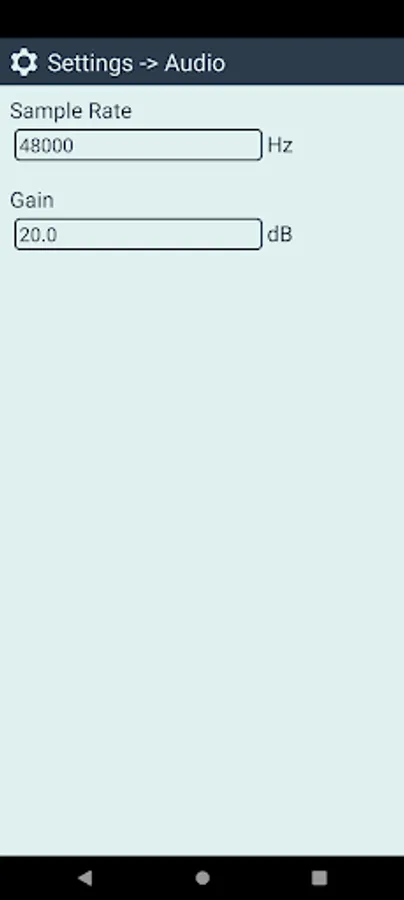
• Sample Rate = the sample rate (in Hz) at which the microphone will be read. Most devices support up to 48 kHz. High-end devices support up to 192 kHz.
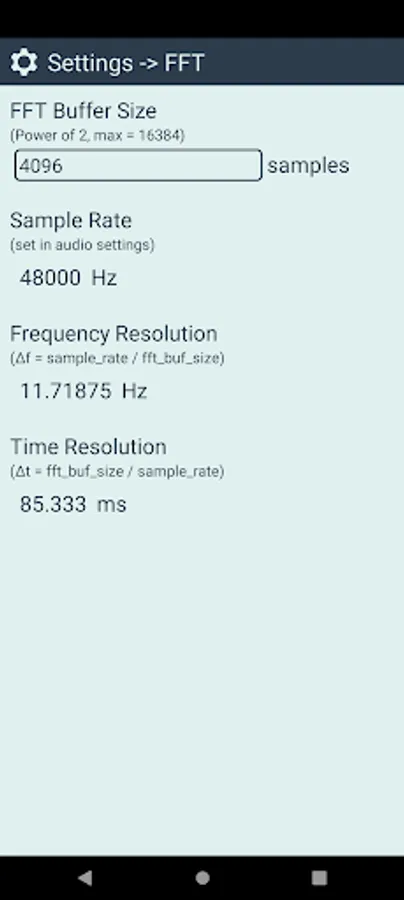
• FFT Buffer Size = the size (in samples) of the audio buffer used to compute the FFT. Must be a power of 2, min = 128, max = 16384. Bigger value gives better frequency resolution. Smaller value gives better time resolution.
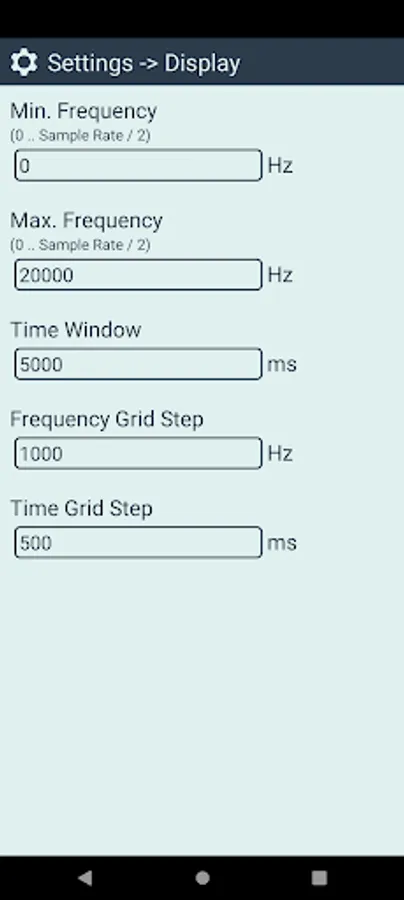
• Min. Dispalyed Frequency
• Max. Displayed Frequency
• Gain (dB)
• Displayed Time Window (in milliseconds)
• Frequency Grid Step (in Hz) = will draw horizontal division lines
• Time Grid Step (in milliseconds) = will draw vertical division lines moving together with the plot.
Free version limitations:
• sample rate = 8000 Hz (fixed)
• FFT buffer size = 512 (fixed)
Users can upgrade to Premium Version via in-app purchase (one time payment).
Premium version advantages:
• configurable sample rate.
• configurable FFT buffer size: 128, 256, 512, 1024, 2048, 4096, 8192, 16384.
Planned features for future app updates:
• show spectrum of audio file
• export spectrum to file
App settings:
• Sample Rate = the sample rate (in Hz) at which the microphone will be read. Most devices support up to 48 kHz. High-end devices support up to 192 kHz.
• FFT Buffer Size = the size (in samples) of the audio buffer used to compute the FFT. Must be a power of 2, min = 128, max = 16384. Bigger value gives better frequency resolution. Smaller value gives better time resolution.
• Min. Dispalyed Frequency
• Max. Displayed Frequency
• Gain (dB)
• Displayed Time Window (in milliseconds)
• Frequency Grid Step (in Hz) = will draw horizontal division lines
• Time Grid Step (in milliseconds) = will draw vertical division lines moving together with the plot.
Free version limitations:
• sample rate = 8000 Hz (fixed)
• FFT buffer size = 512 (fixed)
Users can upgrade to Premium Version via in-app purchase (one time payment).
Premium version advantages:
• configurable sample rate.
• configurable FFT buffer size: 128, 256, 512, 1024, 2048, 4096, 8192, 16384.
Planned features for future app updates:
• show spectrum of audio file
• export spectrum to file
SpecStream Audio Spectrum Plot Screenshots
Tap to Rate:
Reviews for SpecStream Audio Spectrum Plot
Chris Robinson
11/2/2025
First spectrograph with no ads! also instantaneous reading/display
devrim
8/14/2025
perfect for overtone singing