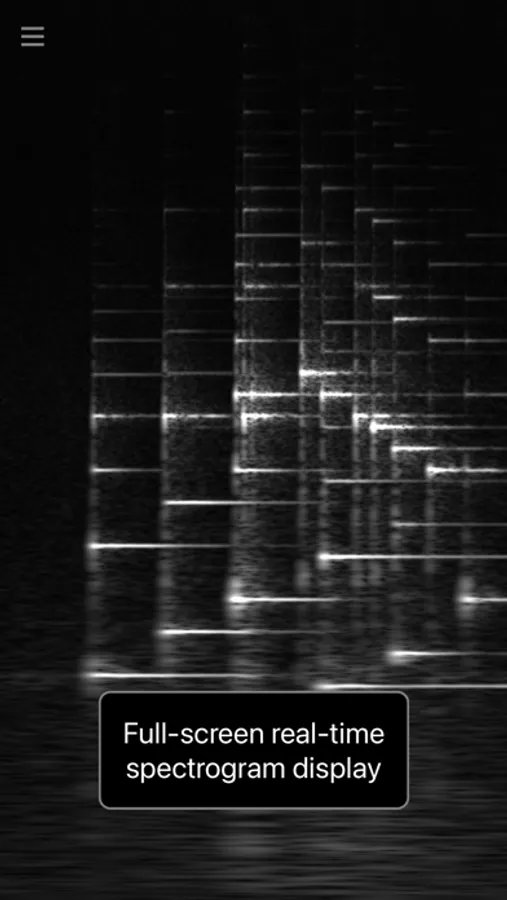
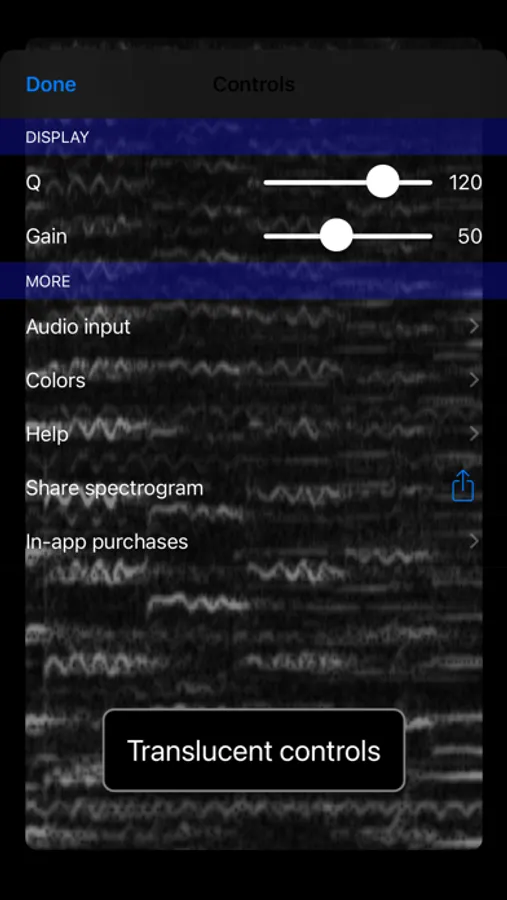
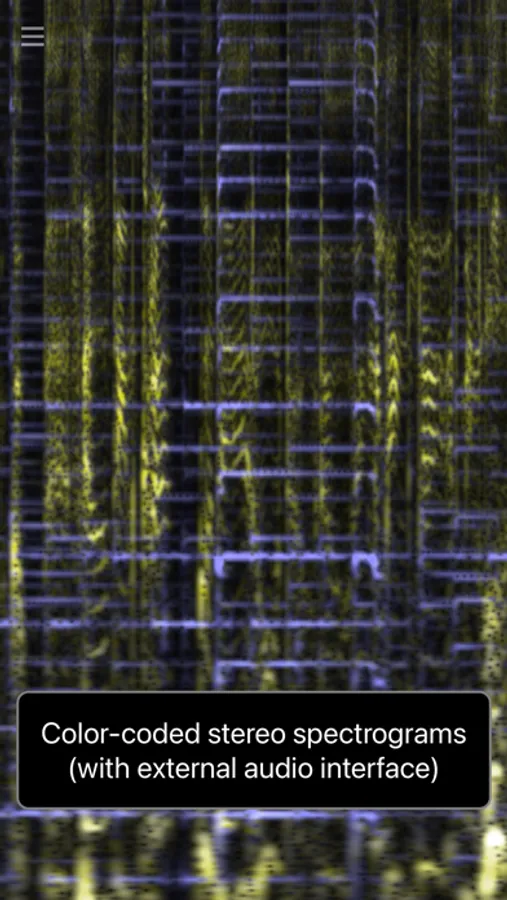
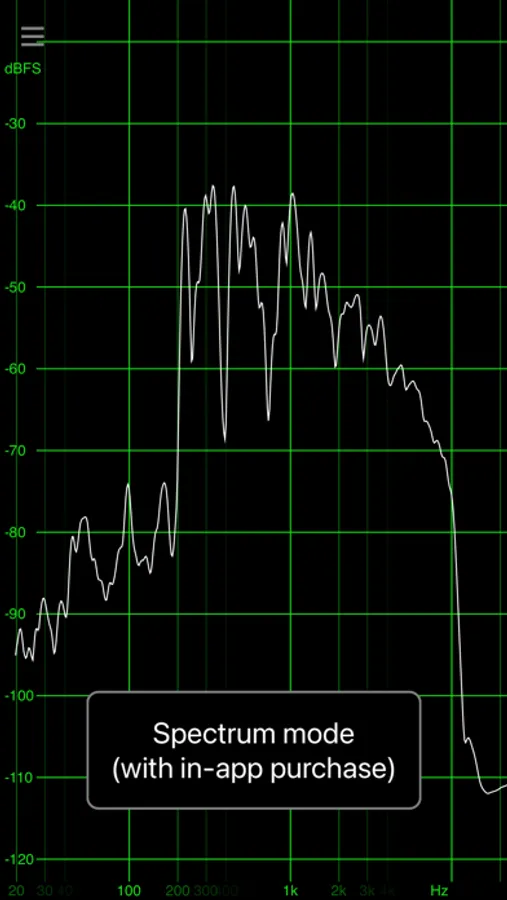
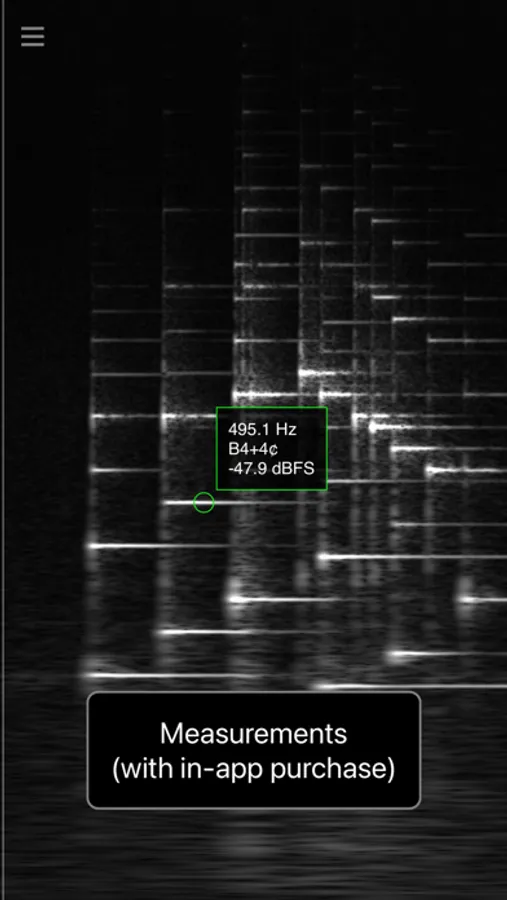
In this app, users can visualize sound as spectrograms in real time and adjust parameters such as gain and Q. Includes support for constant-Q, linear, and mel frequency scales, as well as measurement tools with the Pro version.
AppRecs review analysis
AppRecs rating 4.4. Trustworthiness 81 out of 100. Review manipulation risk 26 out of 100. Based on a review sample analyzed.
★★★★☆
4.4
AppRecs Rating
Ratings breakdown
5 star
90%
4 star
2%
3 star
6%
2 star
0%
1 star
2%
What to know
✓
Low review manipulation risk
26% review manipulation risk
✓
Credible reviews
81% trustworthiness score from analyzed reviews
✓
High user satisfaction
90% of sampled ratings are 5 stars
About Spectrolite
Spectrolite visualizes sound as spectrograms in real time.
Spectrolite supports constant-Q spectrograms, which use a logarithmic frequency scale for a display where musical notes are evenly spaced. Spectrograms based on linear and mel frequency scales are also supported.
The display covers the full frequency range of human hearing. Intuitive touch panning and zooming lets you dive in and explore the spectrograms in detail. Gain, Q, and other parameters can be adjusted in real time and instantly apply to the display of past signals as well as future ones.
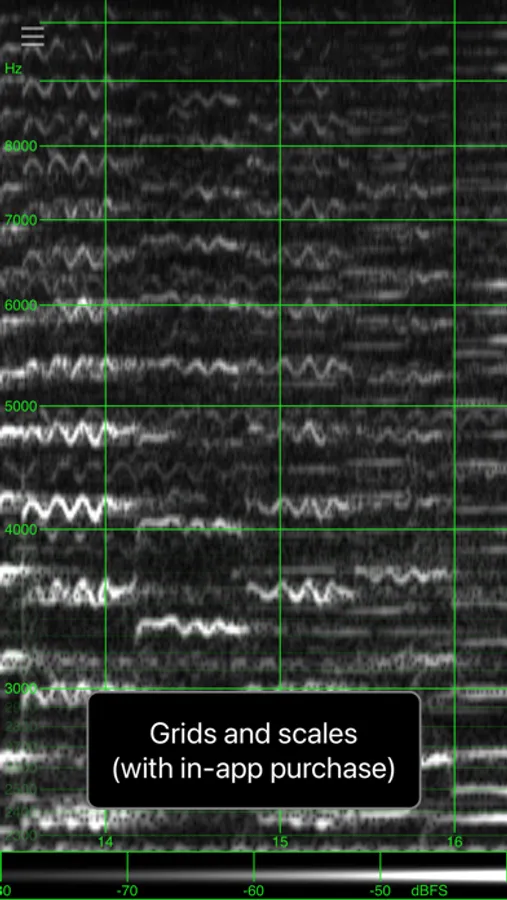
The Pro in-app purchase adds grids and scales for time, frequency, and amplitude, as well as a spectrum view and a tap-to-measure function. This expands Spectrolite into an audio measurement tool that you can use to measure frequencies, musical pitches, amplitudes, and durations.
