AppRecs review analysis
AppRecs rating 4.8. Trustworthiness 70 out of 100. Review manipulation risk 22 out of 100. Based on a review sample analyzed.
★★★★☆
4.8
AppRecs Rating
Ratings breakdown
5 star
80%
4 star
20%
3 star
0%
2 star
0%
1 star
0%
What to know
✓
Low review manipulation risk
22% review manipulation risk
✓
Credible reviews
70% trustworthiness score from analyzed reviews
✓
High user satisfaction
80% of sampled ratings are 5 stars
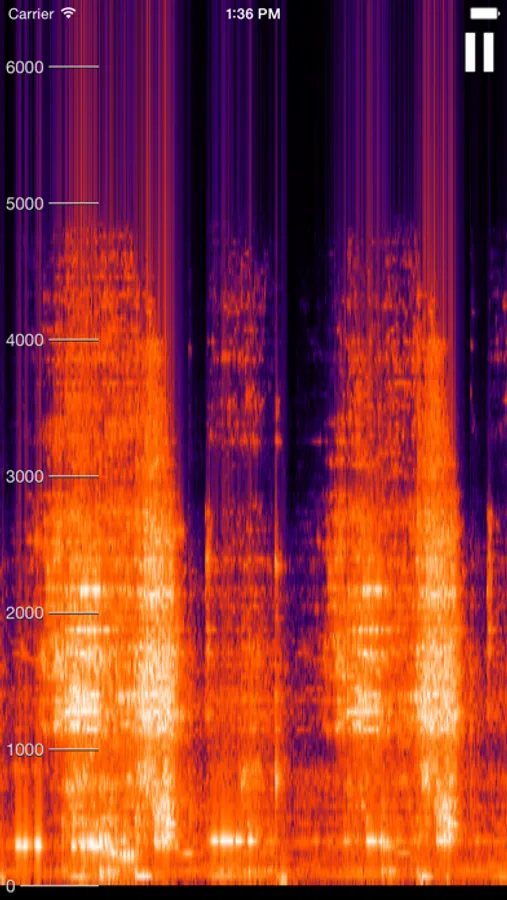
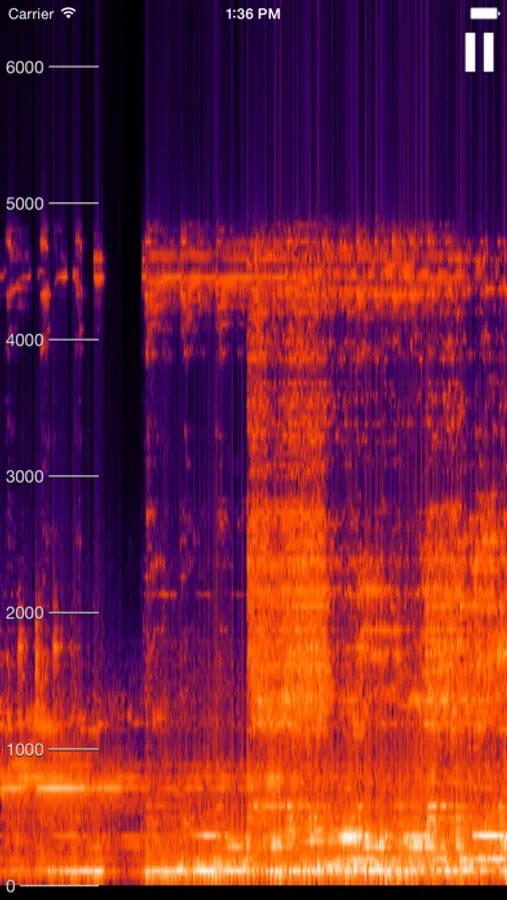
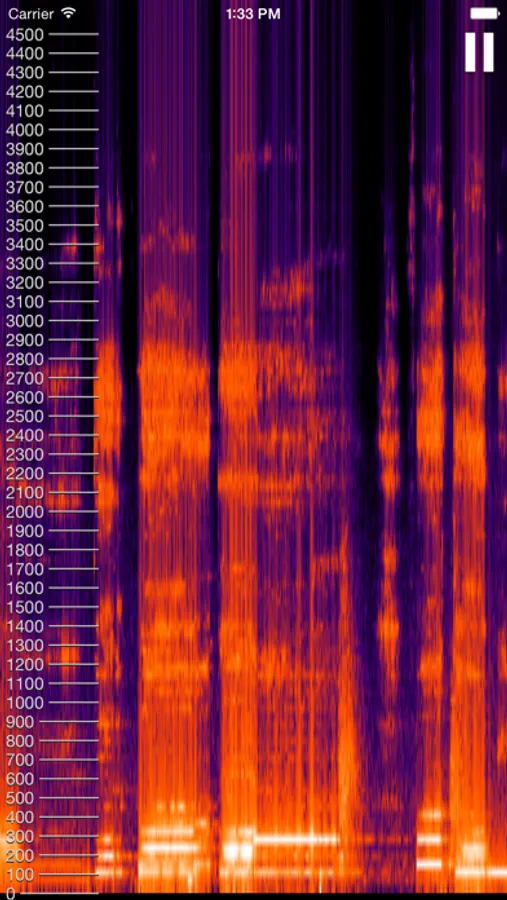
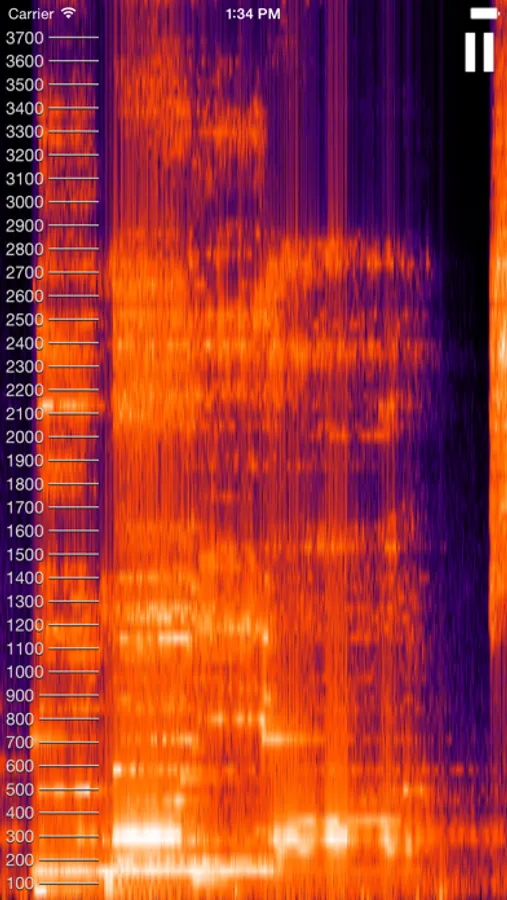
About Live Spectrogram
It displays the frequencies of sound around you over time. The horizontal axis is time, the vertical is frequency, and the intensity of frequencies is shown using pretty shades of red.
Use it to:
Perfect your singing voice
Analyze the call of animals
Identify and locate annoying sounds around your house
Learn about the world of frequency analysis
I hope you enjoy this handy little tool!
Live Spectrogram Screenshots
Tap to Rate:
Reviews for Live Spectrogram
ILoveSoundWaves
Very Detailed Sound Data In High Resolution
This app is simple, but really nice. Of course the better your mic is, the better it will work. I’m using an iPhone 16 which has a really good microphone, and it can pick up sound frequencies that I can’t even hear with my ears. It’s neat to see the real time sounds being printed on the spectrogram. I suppose if I were to want additional features, it would be the ability to record, and also maybe see a history of one minute or two of past sounds. Other than that, I love it and I feel it was worth $2.
Dnb guy
Needs just 1 thing
Please add a save feature. Works perfect but there have been times where I have needed to compare sound levels I can't because if I close the app it erases everything.