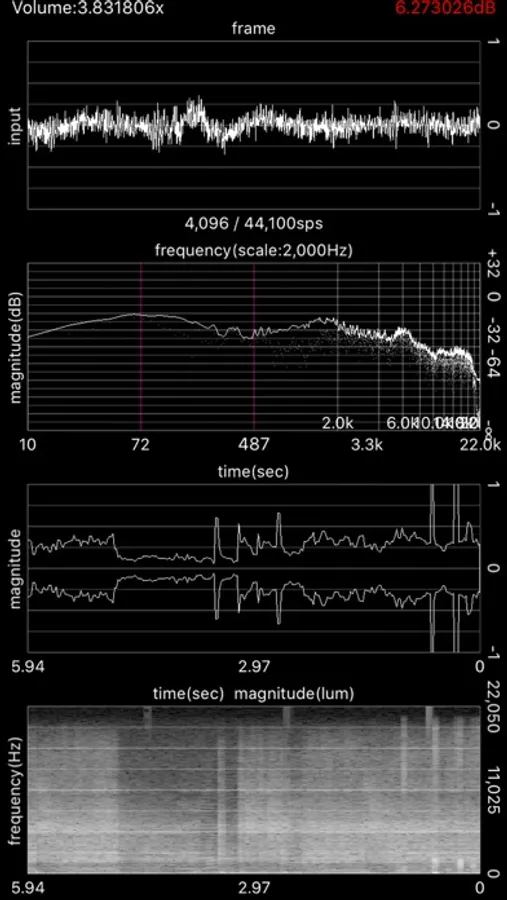
About Audio Analyzer
The analyzed result of the waveform is rendered at 60FPS.
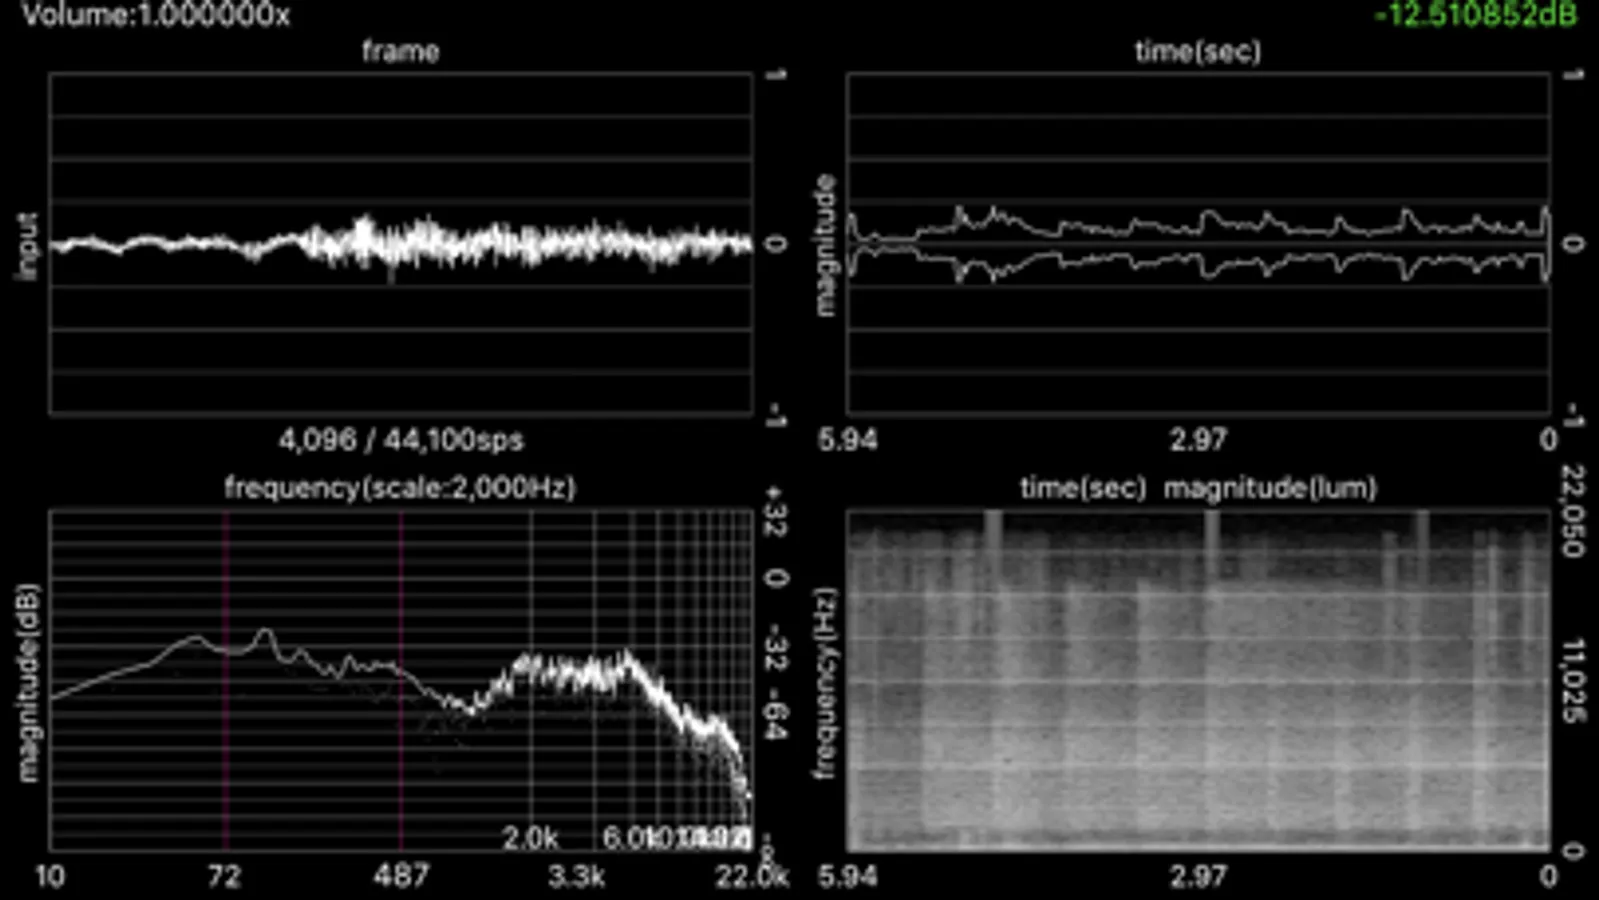
The following 4 functions can be accessed:
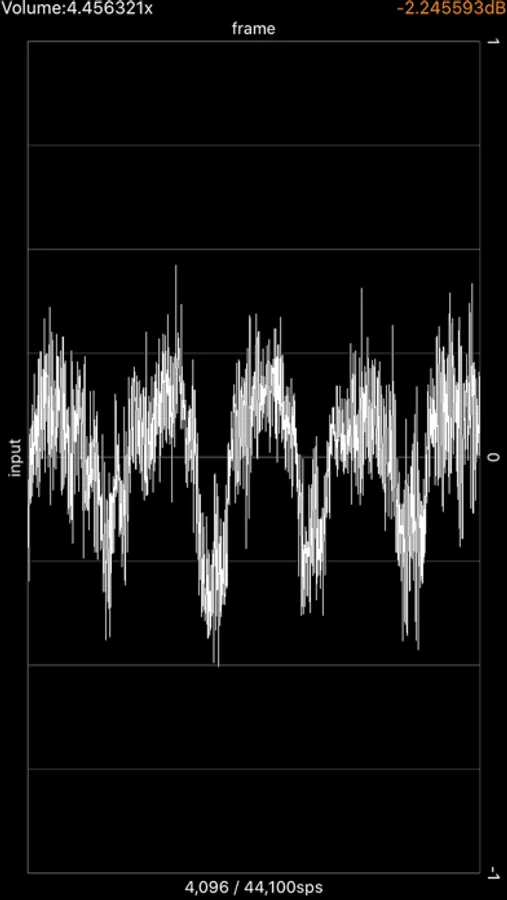
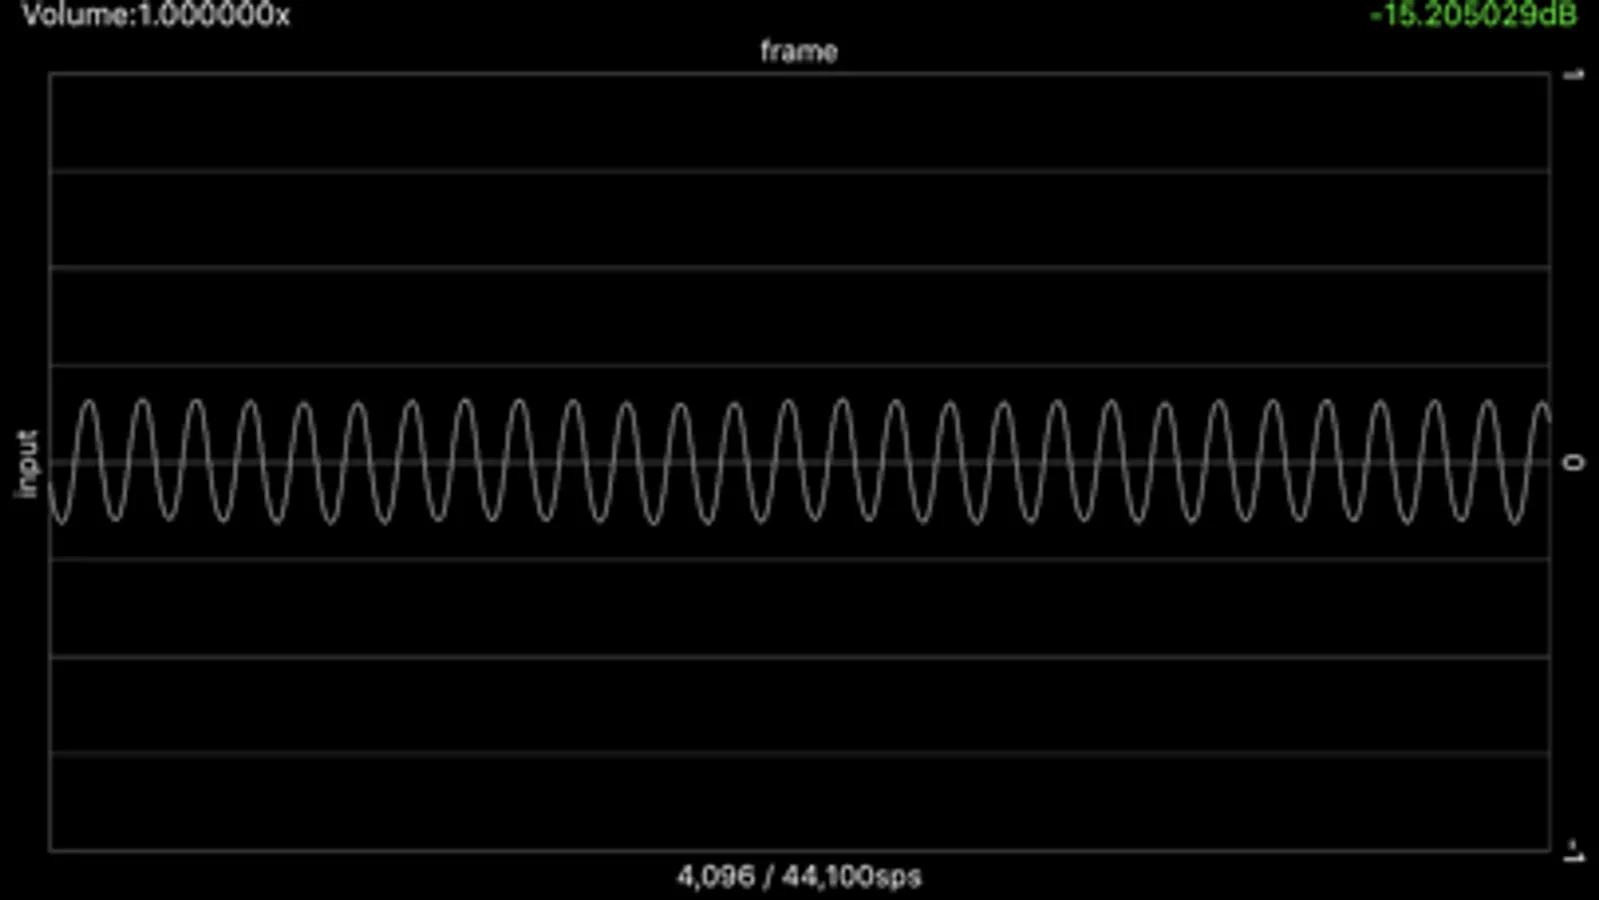
Waveform visualizer (oscilloscope)
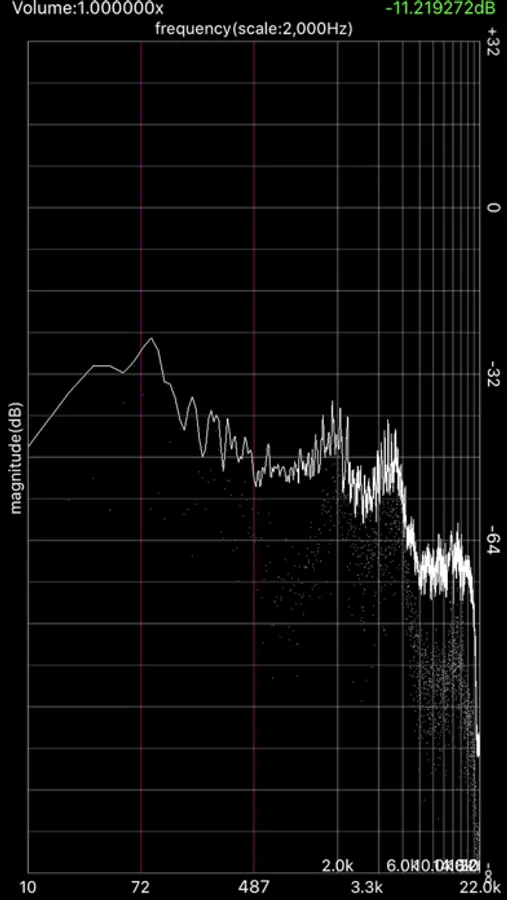
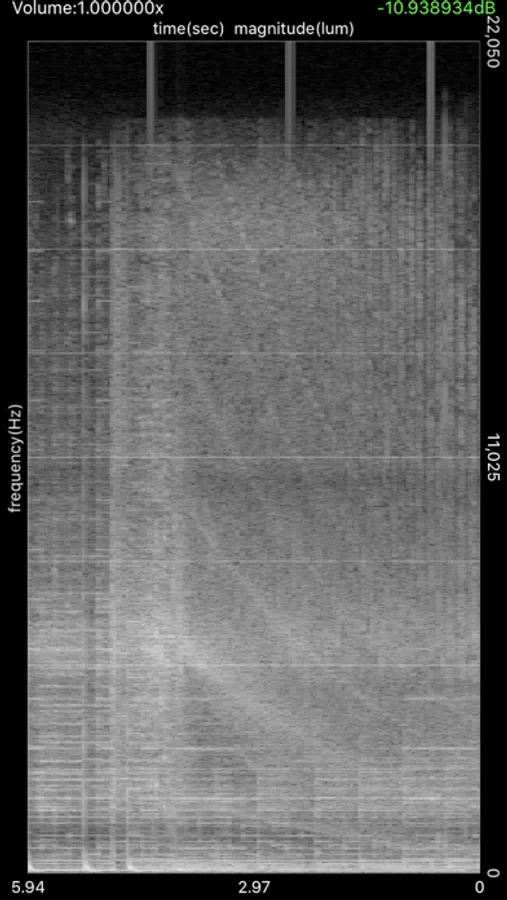
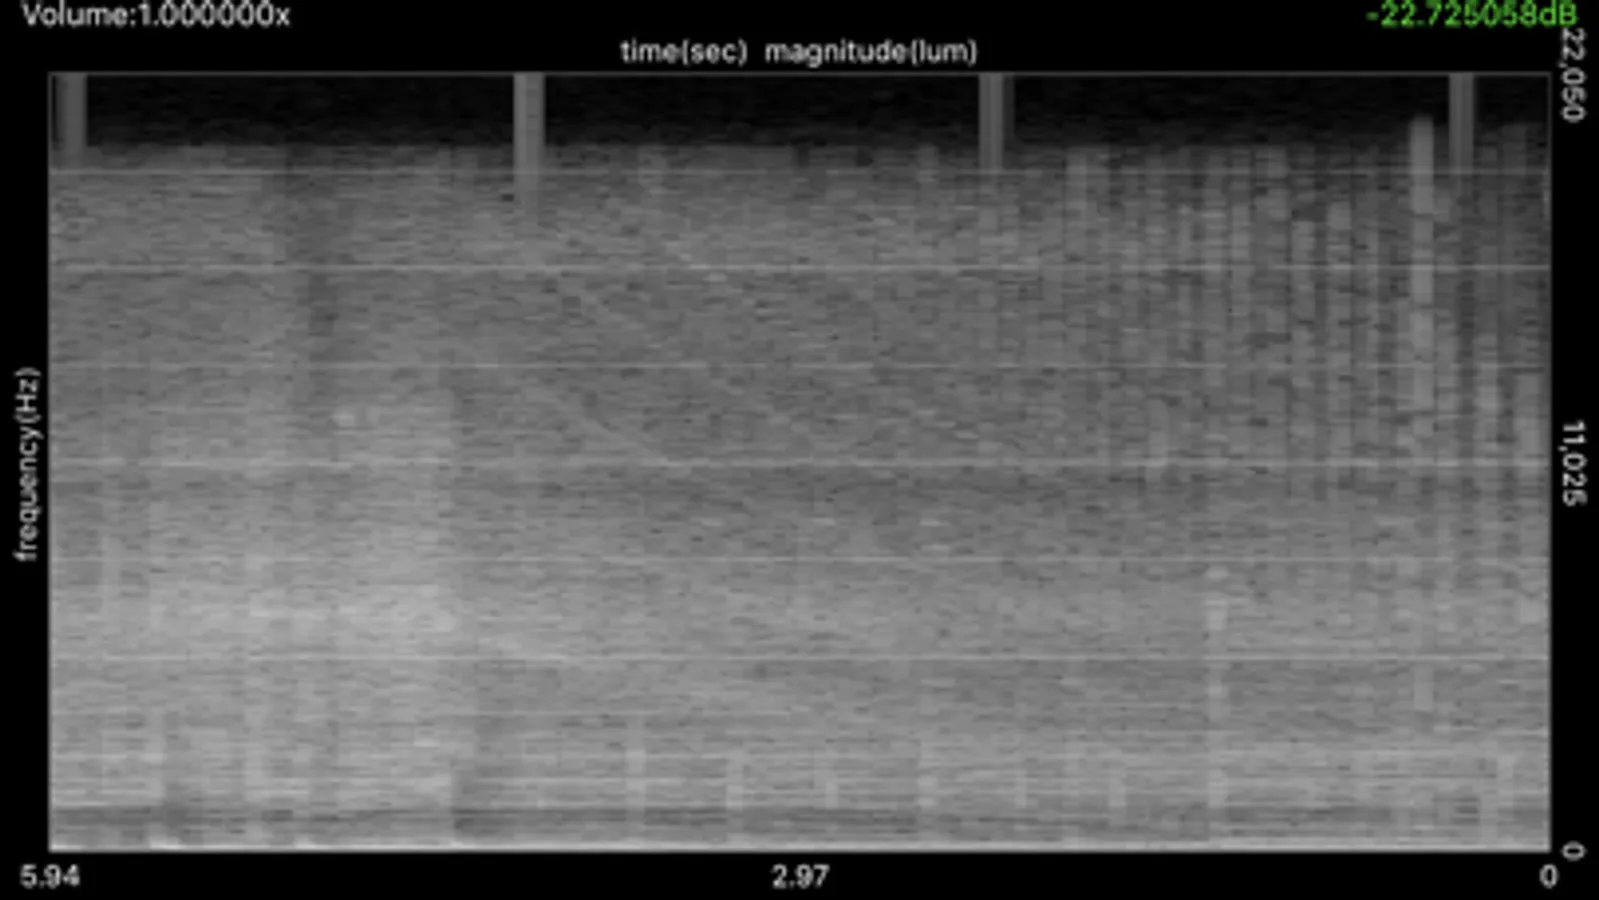
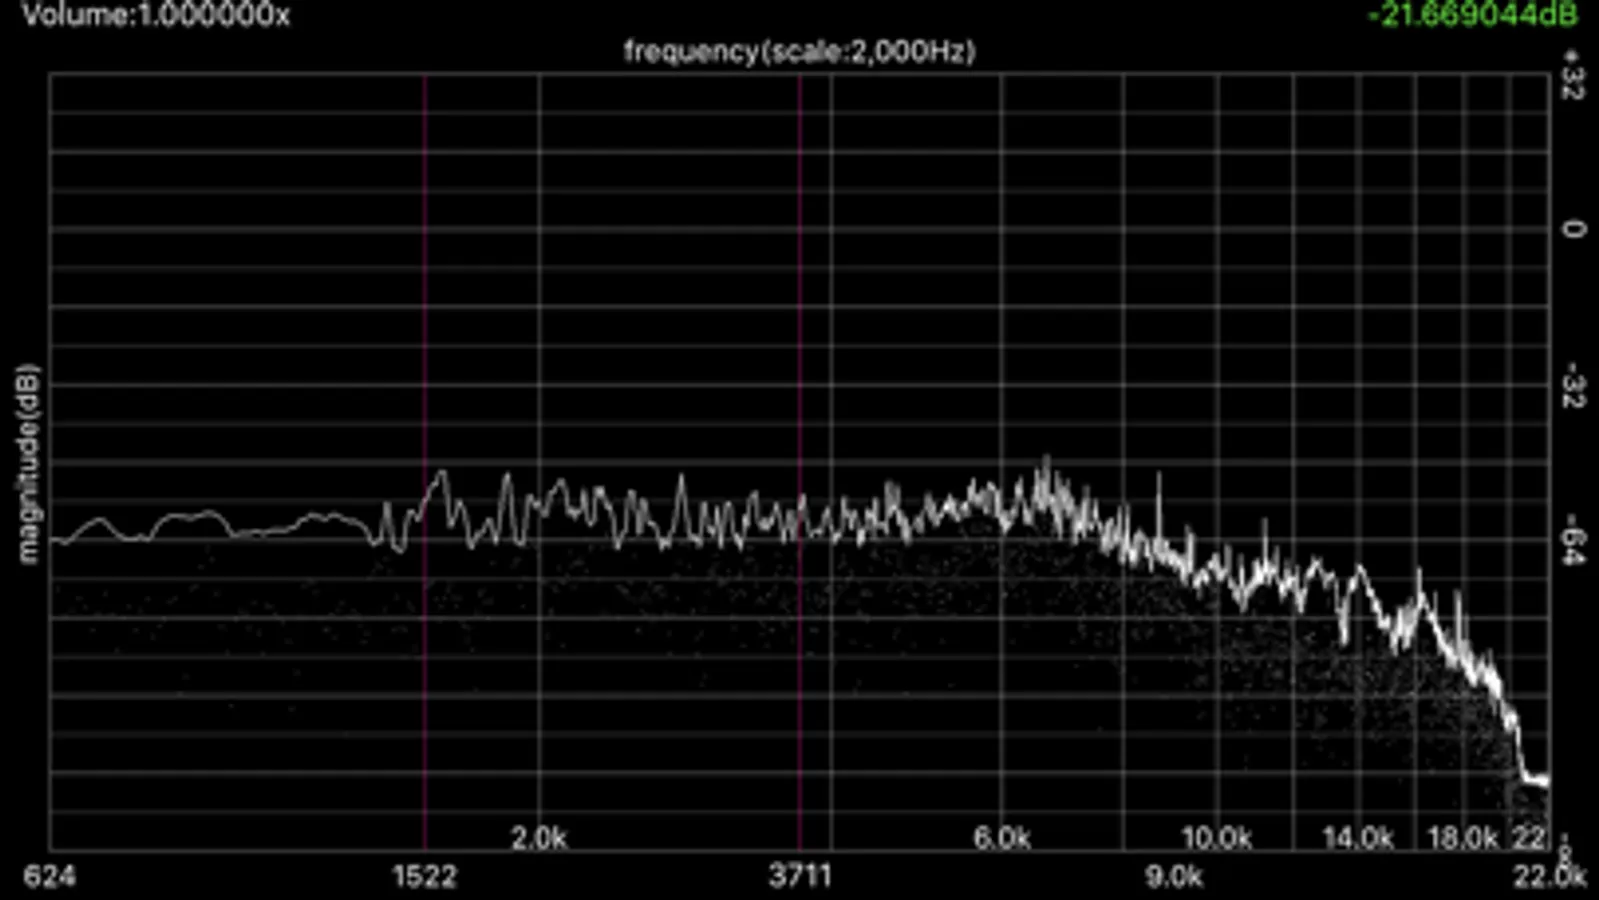
Spectrum analyzer
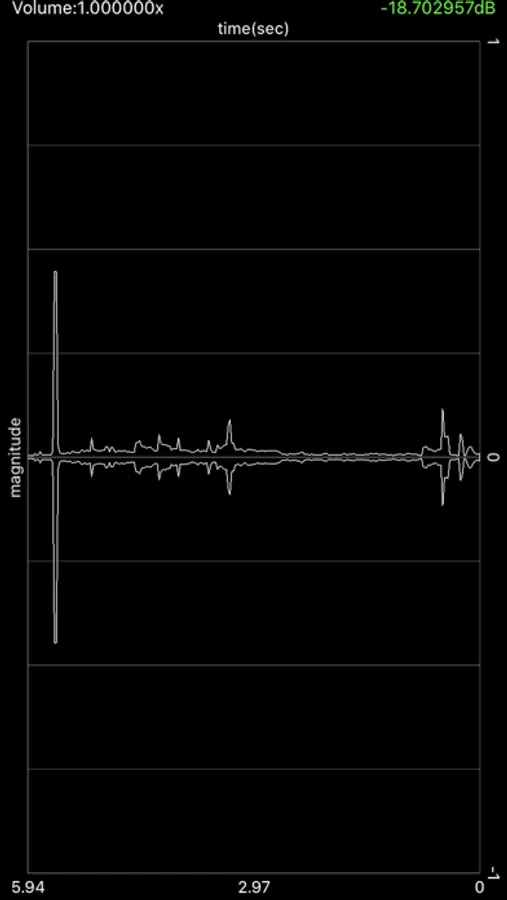
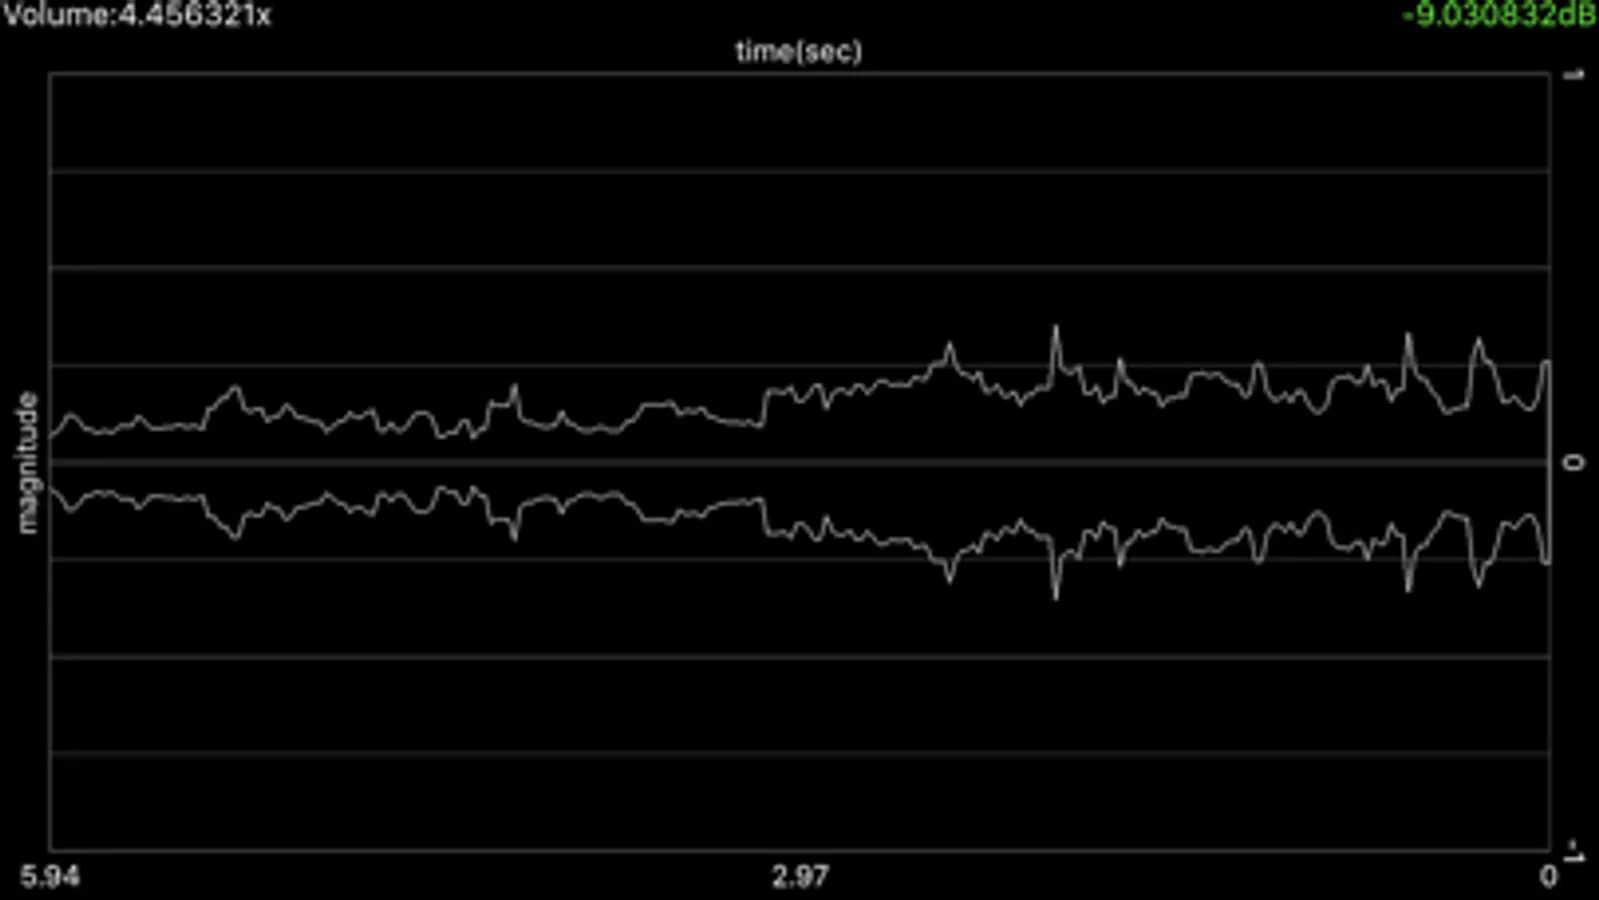
Historical peak
Historical FFT
Tapping each function enters into full-screen mode and tapping once more exits full-screen mode.
Horizontal zoom is only available for the spectrum analyzer. Magnification gesture (aka pinching) allows for zooming in and out, and frequency offset can be performed by swiping on the screen horizontally.
Vertical swiping adjusts input volume. Coefficients are displayed in the corner.
*dBFullScale 20 * log10 ( input)
A demonstration is here.
https://www.youtube.com/watch?v=6mDa_zCgYzE
