AppRecs review analysis
AppRecs rating 3.8. Trustworthiness 78 out of 100. Review manipulation risk 26 out of 100. Based on a review sample analyzed.
★★★☆☆
3.8
AppRecs Rating
Ratings breakdown
5 star
60%
4 star
7%
3 star
7%
2 star
0%
1 star
27%
What to know
✓
Low review manipulation risk
26% review manipulation risk
✓
Credible reviews
78% trustworthiness score from analyzed reviews
✓
Good user ratings
67% positive sampled reviews
About Graph Maker - easy combo chart
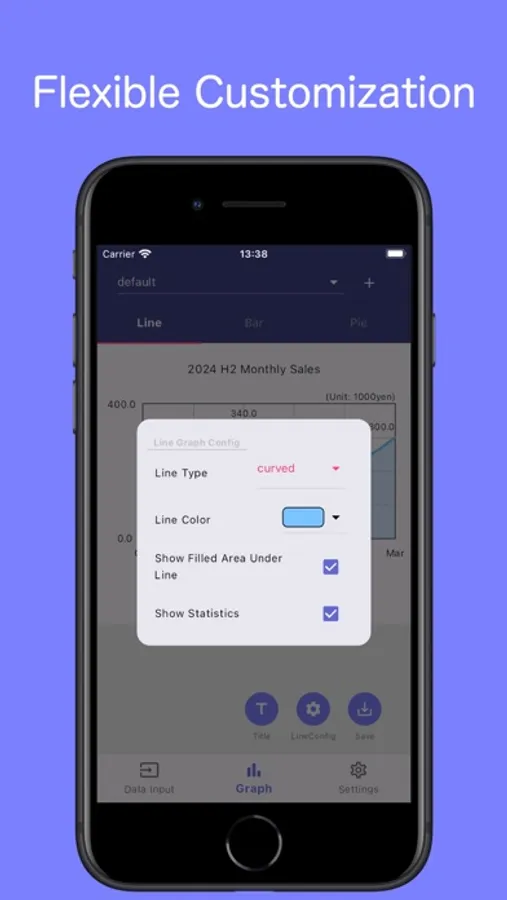
This app quickly creates graphs from simple input.
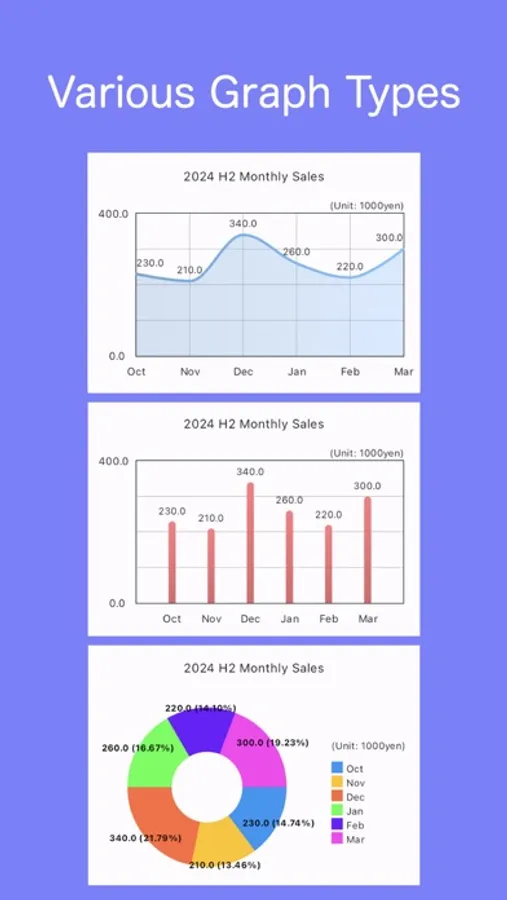
Works with line, bar, and pie graphs.
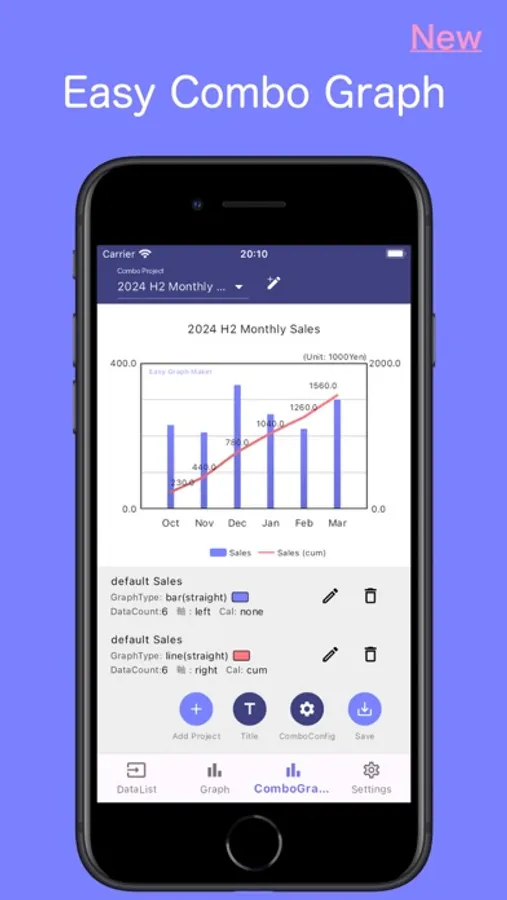
We've also implemented a new combo graph with lines and bars.
Combining a monthly bar graph with a cumulative line graph for each month makes the information much easier to understand.
It's a bit quirky as it instantly draws graphs from input data.
Please check the summary below.
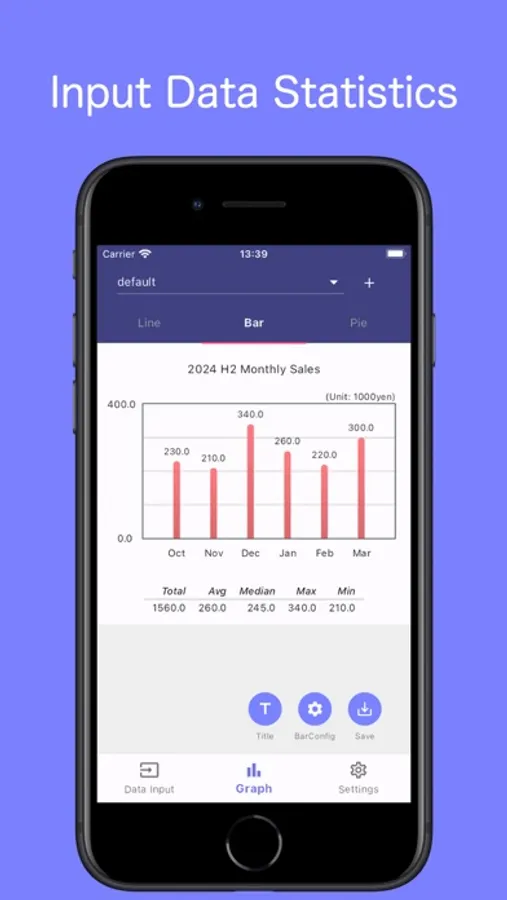
・Data Values
No strict input limits, but for a neat layout, keep characters short.
Adjust units to shorten characters (e.g., [Unit: 1,000 yen]).
・Data Labels:
Adjusted for the longest notation '20231101.'
To minimize data label characters, use '23/11/01' or '11/1' as labels, and include '2023-' in the title.
Labels with 3 or fewer characters display horizontally.
・Pie Charts
If input totals 100, it's % distribution on the graph. If not, it auto-calculates percentages.
Works with line, bar, and pie graphs.
We've also implemented a new combo graph with lines and bars.
Combining a monthly bar graph with a cumulative line graph for each month makes the information much easier to understand.
It's a bit quirky as it instantly draws graphs from input data.
Please check the summary below.
・Data Values
No strict input limits, but for a neat layout, keep characters short.
Adjust units to shorten characters (e.g., [Unit: 1,000 yen]).
・Data Labels:
Adjusted for the longest notation '20231101.'
To minimize data label characters, use '23/11/01' or '11/1' as labels, and include '2023-' in the title.
Labels with 3 or fewer characters display horizontally.
・Pie Charts
If input totals 100, it's % distribution on the graph. If not, it auto-calculates percentages.
Graph Maker - easy combo chart Screenshots

Tap to Rate:
Reviews for Graph Maker - easy combo chart
<3 for Taylor Swift
Meh
It was fine. But too hard to use, didn’t like the layout, and the labels didn’t have enough room
Oh hello.
broken due to ads
this is actually my favorite graphing app but recently something has happened where the initial ad is glitched and does not let me click through to access my data and graphs anymore, please fix this as i cannot access anything